
Bitcoin is holding above $88,000–$90,000 as of December 22, but the market structure beneath the price looks increasingly fragile. Recent volatility, thinning liquidity, and fading demand have raised concerns that crypto may be transitioning from a late bull phase into an early bear market heading into January 2026.
Several on-chain and market-structure indicators now point in the same direction. None of these signals confirms a full bear market on their own. Together, however, they suggest rising downside risk and weakening support.
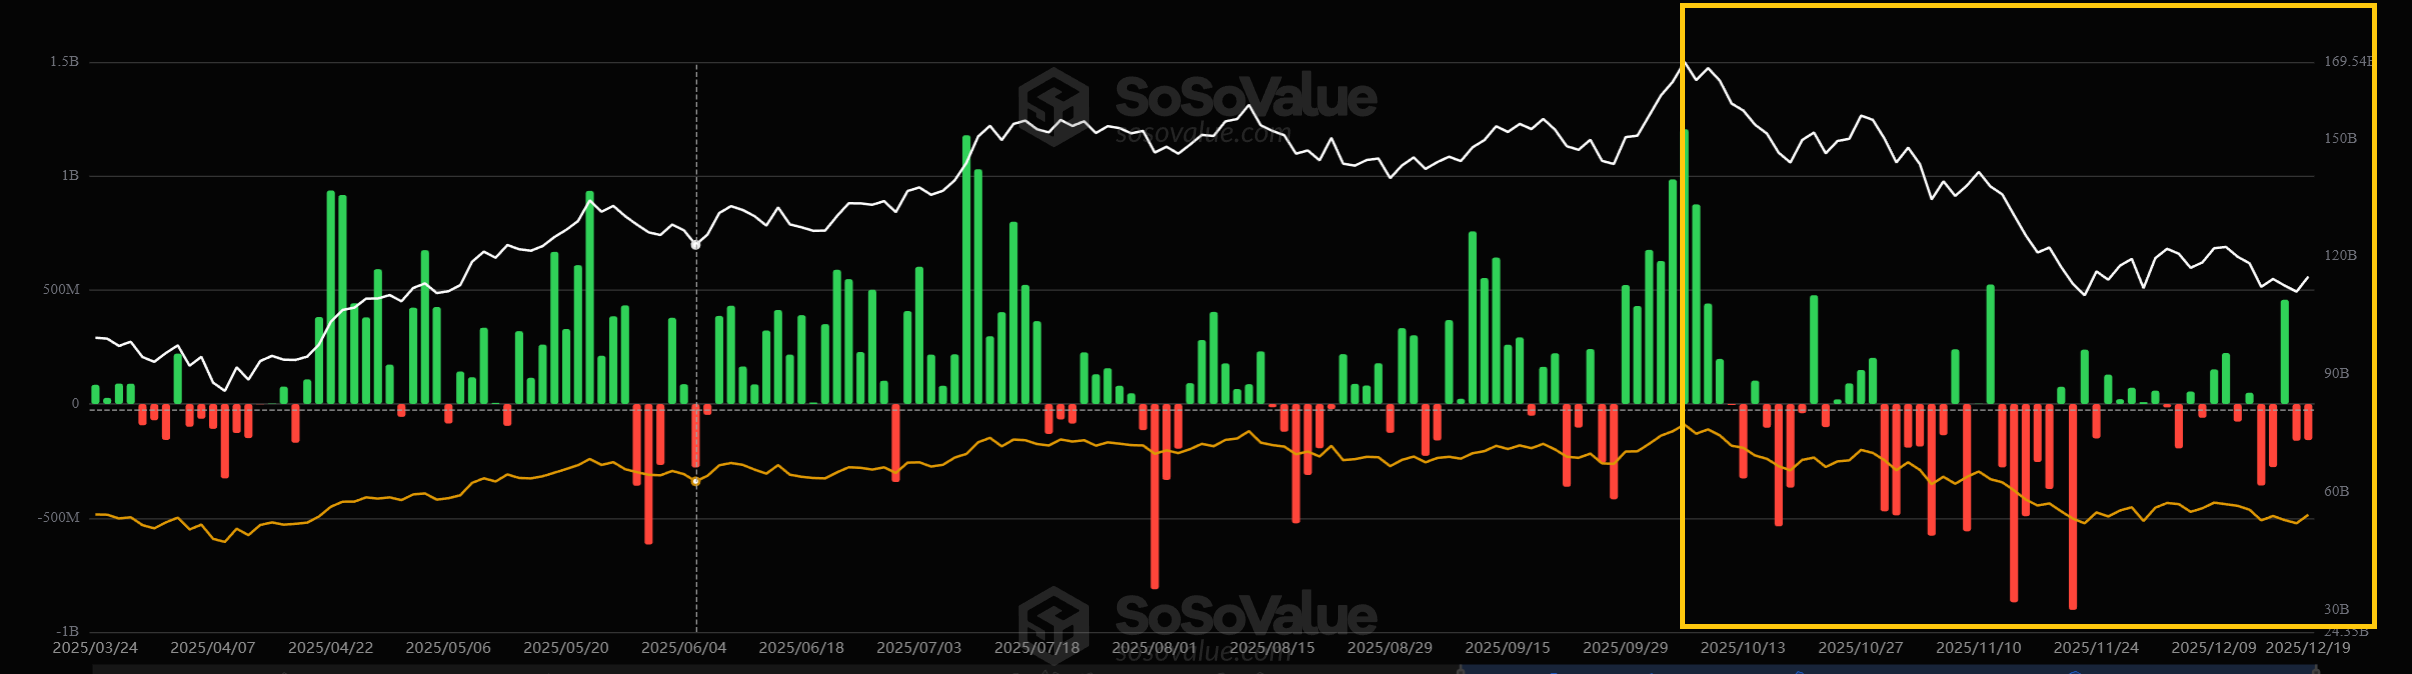
Bitcoin’s Apparent Demand Growth Is Rolling Over
Bitcoin’s apparent demand growth tracks how much new buying pressure exists relative to available supply.
The latest data shows demand growth slowing after multiple waves earlier in the cycle. While Bitcoin price remained elevated through much of 2025, demand failed to make new highs.
Sponsored
Sponsored
This divergence indicates that price strength relied more on momentum and leverage than on fresh spot buying.
Historically, when demand growth flattens or declines while price stays high, markets shift from accumulation into distribution. This often marks the early stages of a bear market or long consolidation.
US Spot Bitcoin ETF Inflows Are Losing Momentum
US spot Bitcoin ETFs have been the strongest source of structural demand in this cycle.
In 2024, ETF inflows accelerated steadily into the year-end. In contrast, Q4 2025 shows inflows flattening and, in some periods, declining.
This shift is important because ETFs represent long-term capital rather than short-term trading.
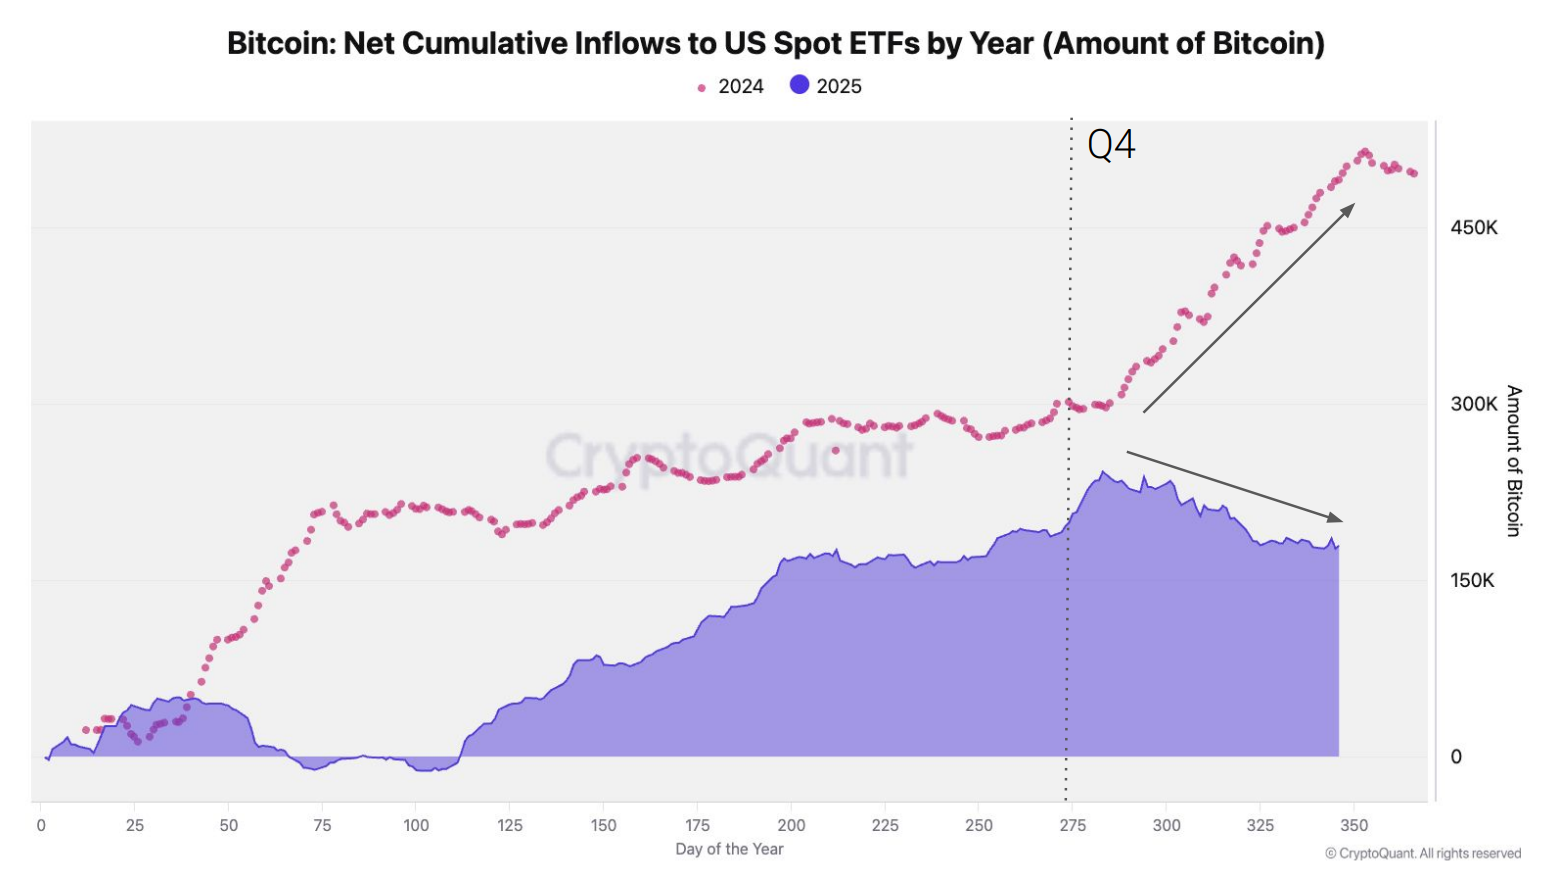
When ETF demand slows while price remains high, it suggests large buyers are stepping back. Without sustained institutional inflows, Bitcoin becomes more vulnerable to volatility driven by derivatives and speculative positioning.
Sponsored
Sponsored
Dolphin Wallets Are Reducing Exposure
Wallets holding 100 to 1,000 BTC, often referred to as “dolphins,” are typically associated with sophisticated investors and funds.
The latest data shows a sharp decline in dolphin holdings on a one-year basis. Similar behavior appeared in late 2021 and early 2022, ahead of deeper market drawdowns.
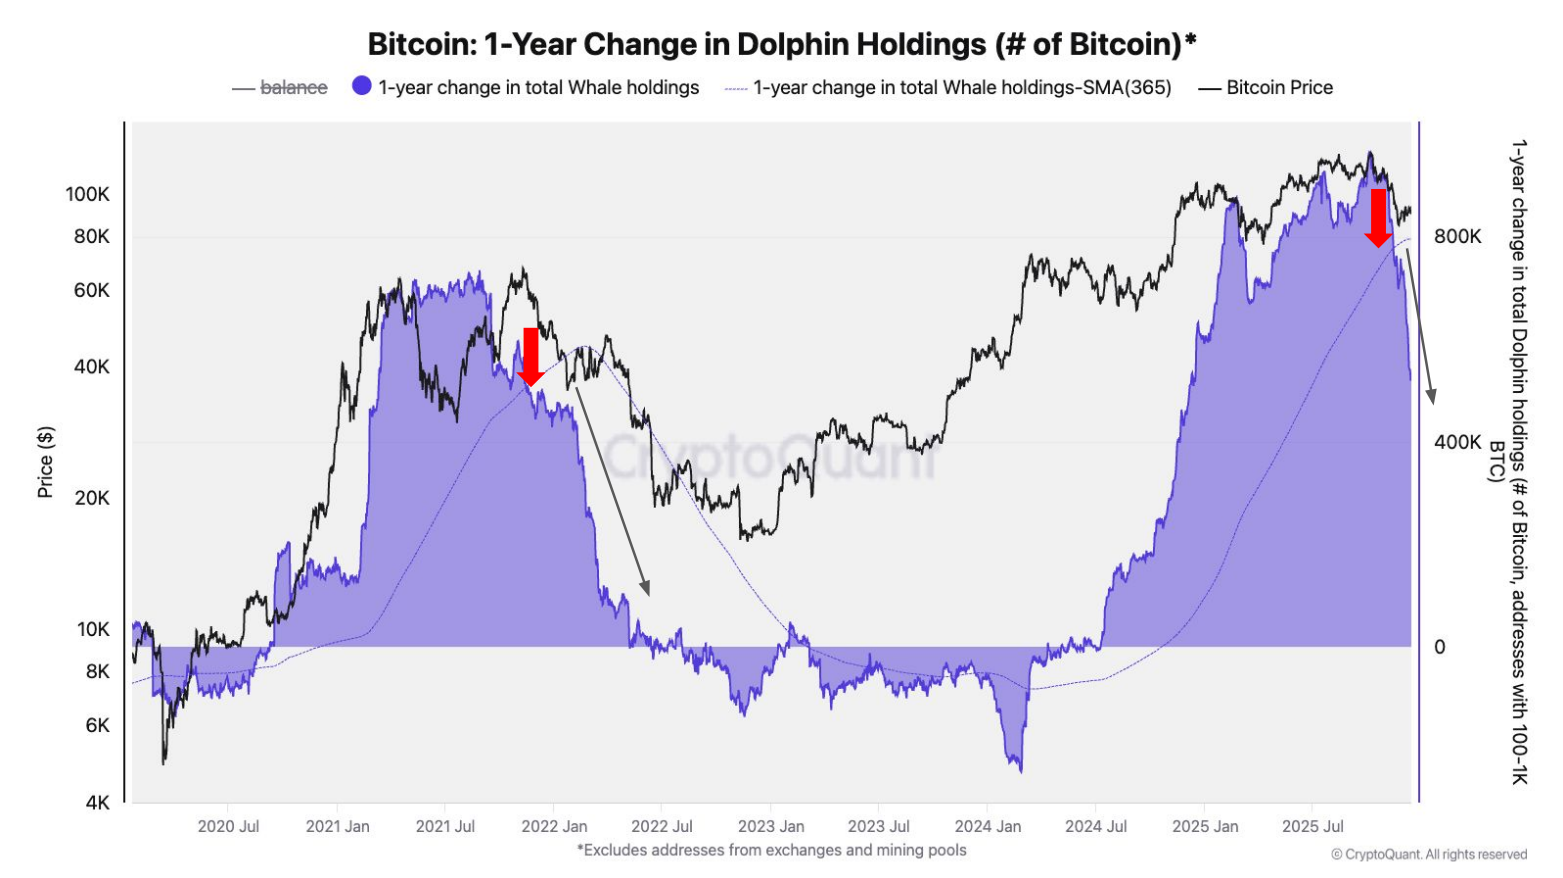
This does not signal panic selling.
Instead, it points to risk reduction by experienced holders. Historically, when this cohort distributes while price remains elevated, it reflects expectations of lower returns or prolonged consolidation ahead.
Funding Rates Are Trending Lower Across Exchanges
Funding rates measure the cost traders pay to hold leveraged positions.
Across major exchanges, Bitcoin funding rates have entered a clear downward trend. This indicates waning demand for leverage, even as price remains relatively high.
Sponsored
Sponsored
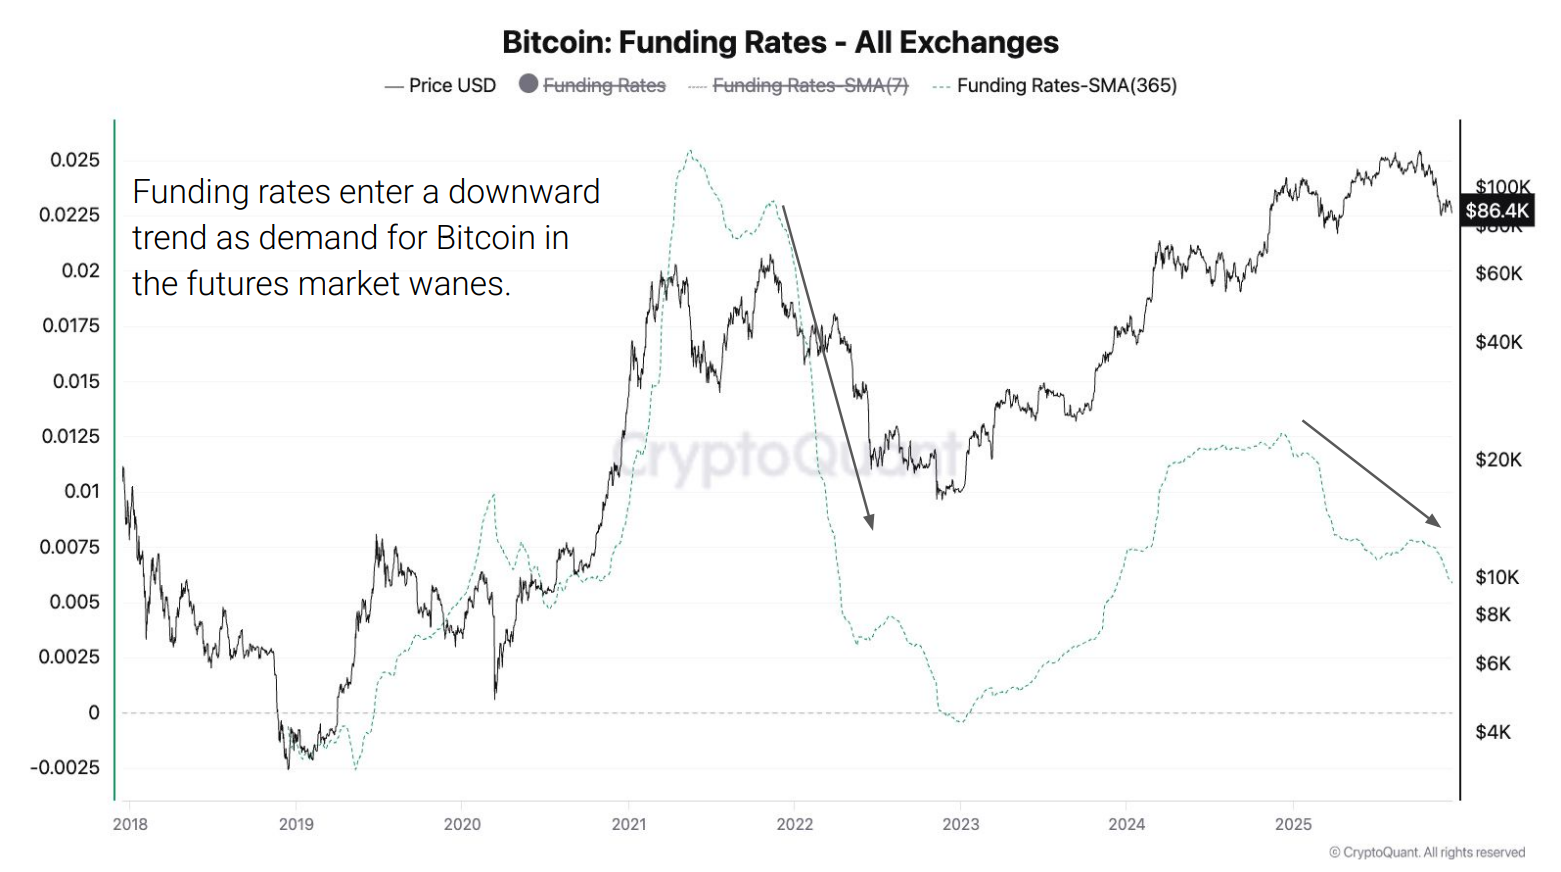
In bull markets, strong rallies are supported by rising funding and persistent long demand.
In contrast, falling funding rates suggest traders are less confident and less willing to pay to stay long. This environment often precedes choppy price action or broader trend reversals.
Bitcoin Broke Below the 365-Day Moving Average
The 365-day moving average is a long-term trend indicator that historically separates bull markets from bear markets.
Bitcoin has now crossed below this level for the first sustained period since early 2022. Previous macro-driven sell-offs in 2024 and early 2025 tested this level but failed to close below it.
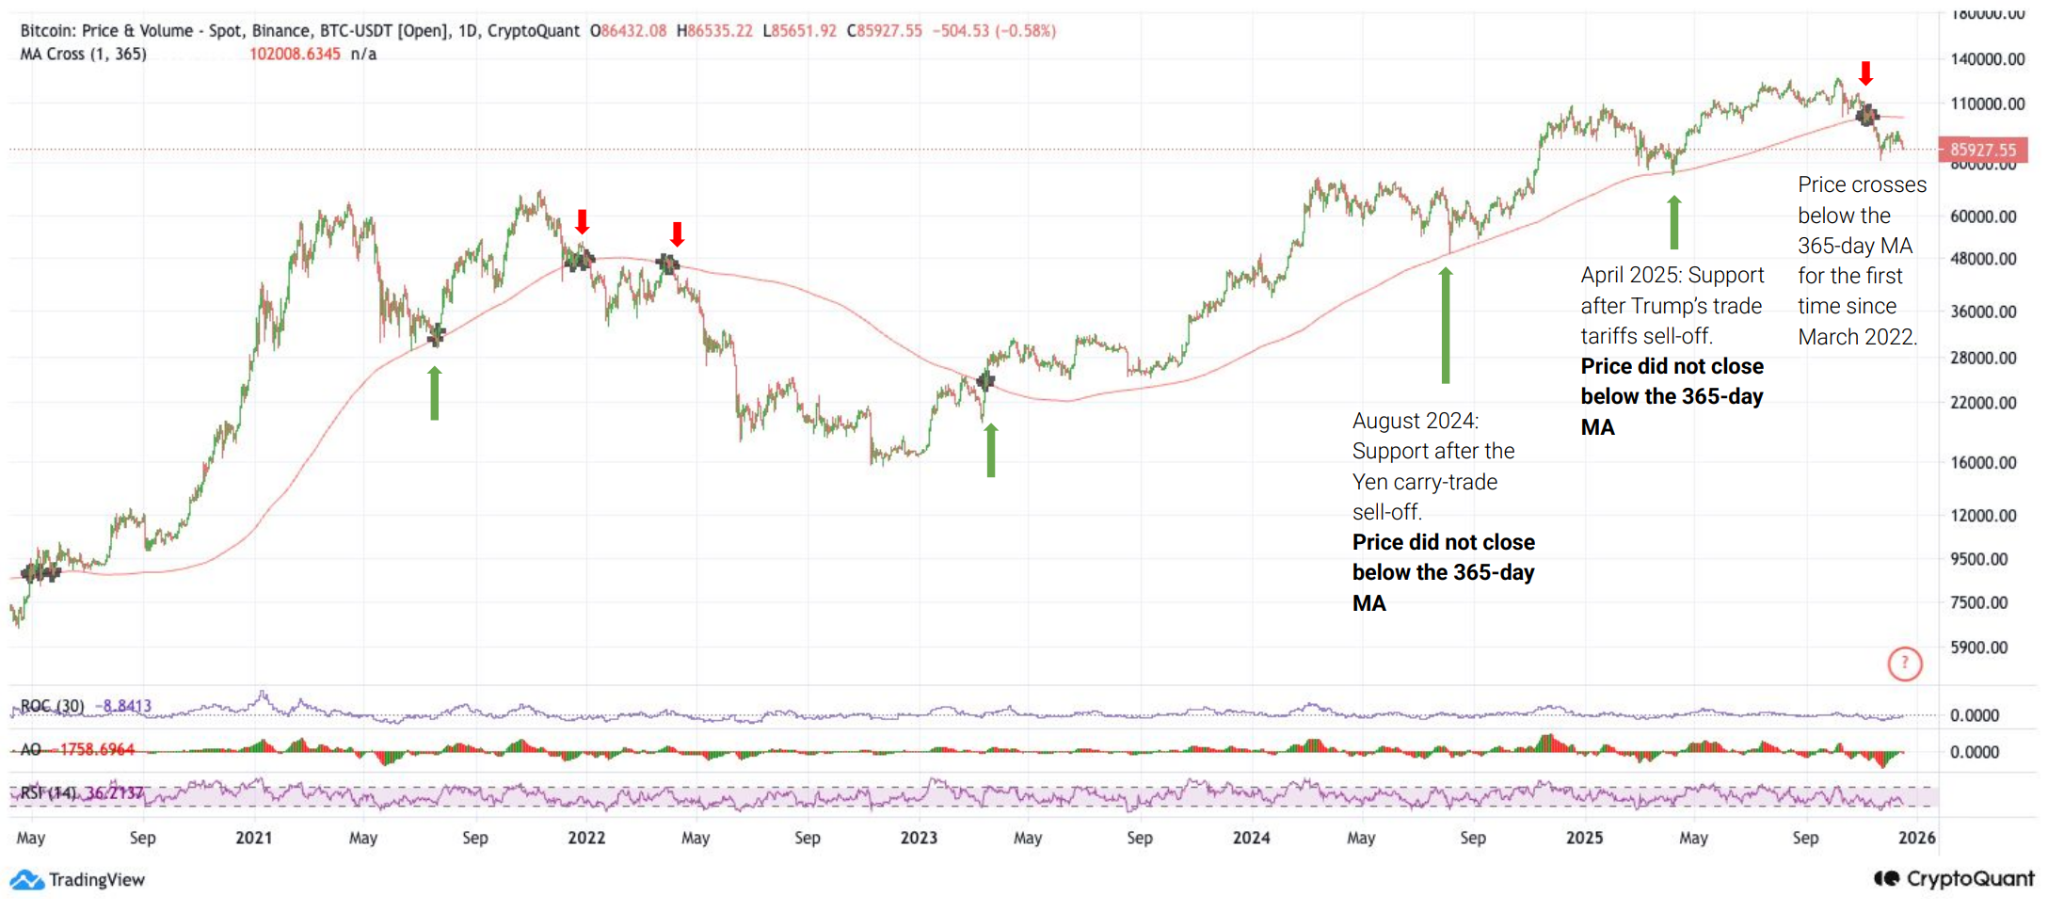
A sustained break below the 365-day average does not guarantee a crash. However, it signals a shift in long-term momentum and increases the probability that rallies will face stronger resistance.
Sponsored
Sponsored
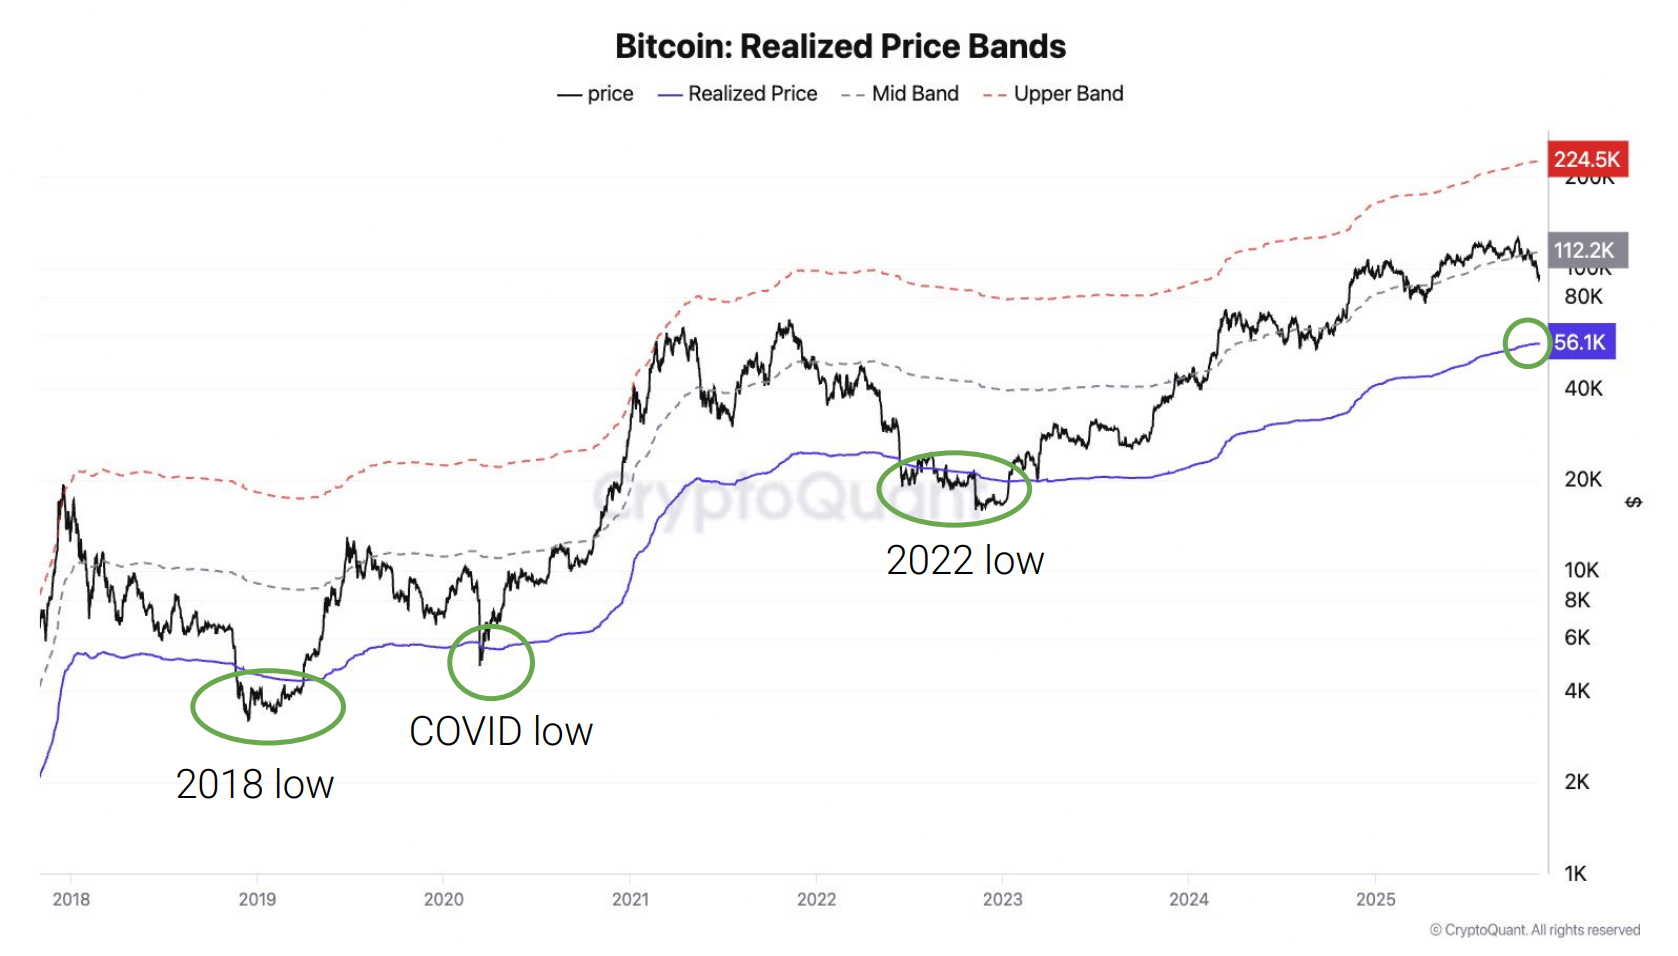
How Low Could Bitcoin Go If a Bear Market Develops?
If these signals continue to align, historical data offers a reference point rather than a prediction.
Bitcoin’s realized price, currently near $56,000, represents the average cost basis of all holders. In prior bear markets, Bitcoin often bottomed near or slightly below this level.
That does not mean Bitcoin must fall to $56,000. It does suggest that, in a full bear scenario, long-term buyers historically step in closer to that zone.
Between current levels and realized price lies a wide range of potential outcomes, including prolonged sideways movement rather than a sharp decline.
What This Means for the Market Right Now
As of December 22, Bitcoin remains range-bound with thin liquidity and high sensitivity to leverage-driven moves. Retail participation appears cautious, while institutional flows have slowed.
Altcoins remain more exposed than Bitcoin. They rely more heavily on retail demand and suffer more quickly when liquidity thins.
Taken together, these five charts suggest crypto may be entering a late-cycle distribution phase, with rising risk of a bear market emerging in early 2026 if demand does not recover.
The trend is weakening, not broken beyond repair. But the margin for error is shrinking.