
- Whale accumulation has slowed down as leverage rose, signaling high-risk positioning before a breakout
- Ethereum burn rate dropped sharply too, weakening the network’s deflationary support
Ethereum [ETH], at the time of writing, seemed to be consolidating within a critical range, trading between two significant supply zones of $1,540 and $1,630. In fact, on-chain data revealed that over 7.9 million ETH held by addresses were bought within this price range, forming a high-stakes battlefield for bulls and bears.
The last 24 hours saw minimal volatility on the altcoin’s charts, with ETH down by just 0.37%. This tight compression suggested that a decisive breakout in either direction could define the next leg of its trend trajectory.
For Ethereum, the IOMAP chart highlighted robust support between $1,513 and $1,585, where 6.6 million ETH is held “in the money.” On the contrary, resistance might be building between $1,585 and $1,630, with 3.37 million addresses holding 7.91 million ETH at a loss.
These clusters clearly seemed to underline where most market participants may be positioned, creating strong zones that ETH must overcome to move meaningfully.
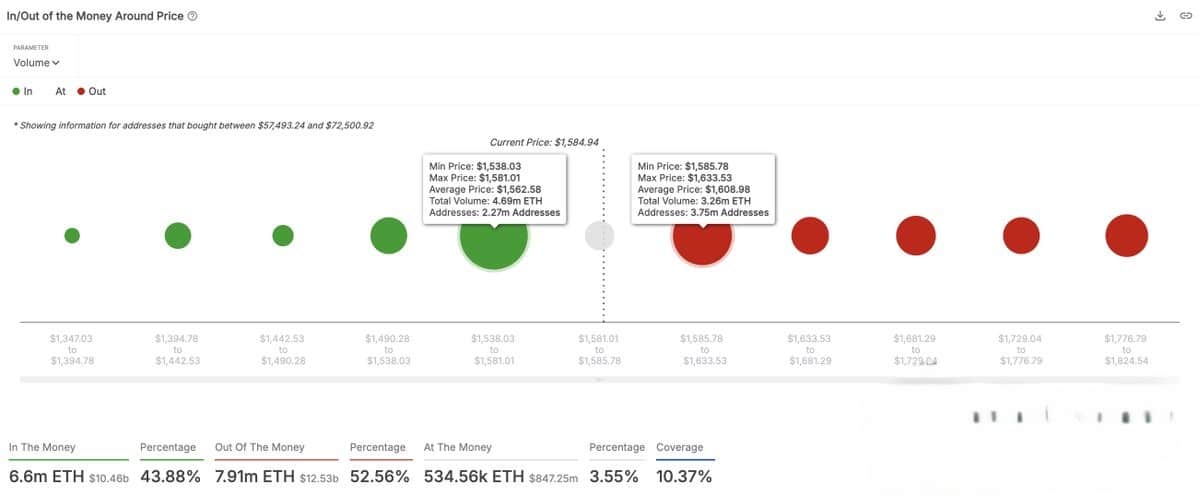
Source: IntoTheBlock
Will the downtrend prevail as ETH tests mid-channel?
A closer look at the technical structure revealed that ETH is still trading within a broad descending channel stretching back to January 2025. This downtrend has consistently suppressed bullish momentum, pushing ETH lower each time it touches the upper resistance band.
Lately, the price action has been flirting with the channel’s midline, showing hesitation from both bulls and bears. Unless buyers break above $1,630, the bearish structure will remain intact. The lower boundary of the channel aligned closely with the $1,475 support zone too.
If this bearish narrative gains momentum, this level could act as the next critical downside target. To put it simply, this price structure reinforces the significance of the $1,630-resistance acting as a potential pivot.

Source: TradingView
Are whales and leverage traders preparing for a major move?
Whale activity painted a mixed picture though. Over the last seven days, large holders netflows increased by 10.76% – A sign of minor accumulation.
However, the 30-day change highlighted a stark decline of 46.70%, confirming recent heavy distribution. On a broader 90-day scale, netflows were still slightly positive, hovering at +1.77%.

Source: IntoTheBlock
Meanwhile, the estimated leverage ratio rose to 0.7009, up 1.01% in the last 24 hours.
This uptick hinted at growing speculative interest and rising leverage across exchanges. Therefore, if ETH breaks out of this range, a volatility spike driven by liquidations could follow.
Is ETH losing its deflationary strength?
The percentage of ETH fees burned has weakened significantly. The 7-day average burn rate dropped to 27.08% too, well below the 90-day average of 42.38%. This drop reflected lower network activity and demand, softening ETH’s deflationary pressure.
Therefore, without a meaningful hike in on-chain activity, bullish follow-through may struggle to sustain any momentum on the charts.

Source: IntoTheBlock
ETH is at a tipping point right now. Price action, on-chain clusters, and whale activity all indicated that a major move may be brewing. However, the bearish structure, declining burn rate, and rising leverage suggested that bulls must act fast to avoid any further downside.
A breakout above $1,630 could unlock targets at $1,860 and beyond. However, failure to hold $1,540 may invite a sharp correction towards $1,475.