The Bitcoin Cash (BCH) price has increased since August 17. It broke out from a corrective pattern 12 days later.
While the weekly timeframe readings are inconclusive, the daily chart suggests that the upward movement is expected to continue and that a new yearly high is possible.
Bitcoin Cash Bounces, Trades in the Middle of Its Range
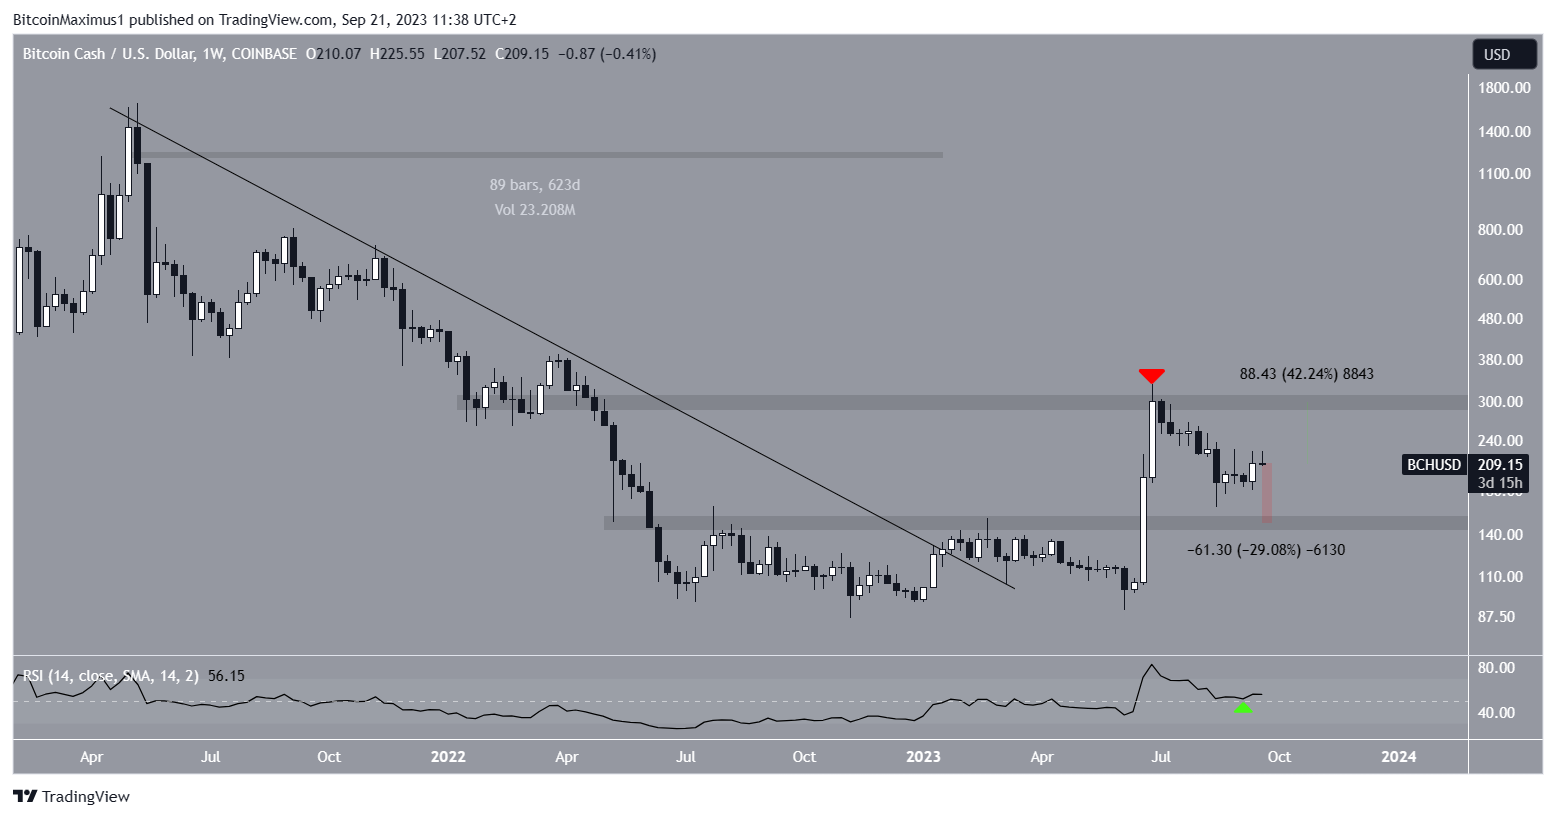
The weekly timeframe technical analysis of BCH’s price movement reveals that back in January, the price managed to break free from a longstanding descending resistance line that had been in place for 623 days.
However, BCH faced difficulties in sustaining its upward momentum after this breakthrough.
Your financial future is a click away. Predict BCH prices now.
It wasn’t until June that it saw a notable increase, reaching a new yearly high at $329. Unfortunately, the price has since fallen, confirming the $300 level as a significant resistance level (red icon).
If this downward trend persists, the closest support level can be identified at $150. Reaching it signifies a 30% drop from the current price. Conversely, to return to the $300 range, BCH would need to increase by 40%.
While the price action is neutral, the weekly Relative Strength Index (RSI) is bullish. The RSI is a tool used by traders to gauge whether a market is exhibiting excessive buying (overbought) or selling (oversold) conditions. This guides their decisions to buy or sell assets.
Typically, RSI readings above 50 and an upward trend indicate a bullish sentiment. Readings below 50 suggest the opposite. The RSI has bounced at the 50 mark (green icon), a sign of a bullish trend.
The Bottom Is in – According to the BCH Price Wave Count
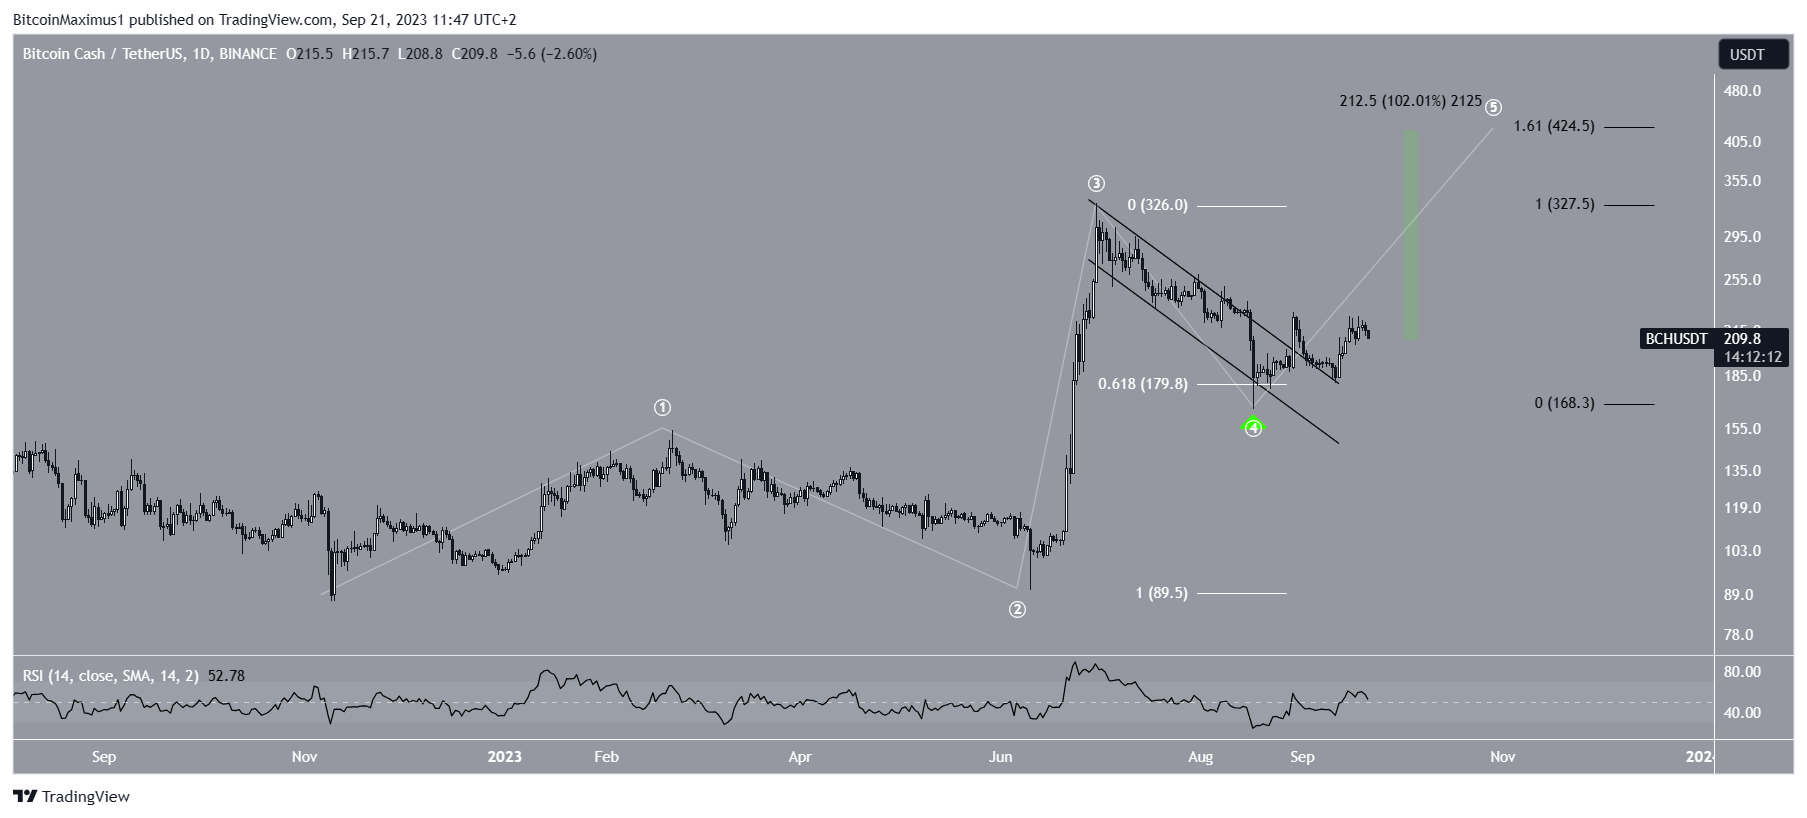
While the weekly timeframe is somewhat undetermined, the daily timeframe readings are decisively bullish. This analysis comes from both the price action and the Elliott Wave count.
Technical analysts employ the Elliott Wave theory to determine the direction of a trend by analyzing recurring, long-term price patterns and considering investor psychology.
According to the wave count, BCH has initiated the fifth and final wave of its upward movement (white). This fifth wave commenced after the cryptocurrency rebounded from the 0.618 Fibonacci retracement support level at $180 on August 17 (green icon).
If this BCH price wave count is accurate, the cryptocurrency’s price is expected to reach a high close to $25. The target is found by the 1.61 Fibonacci extension of the fourth wave’s decline (black).
Further supporting this count is a breakout from a descending parallel channel that had contained the movements of the fourth wave. Finally, the daily RSI is above 50 and increasing, both signs of a bullish trend.
Consequently, the most probable future trajectory appears to be an increase towards $425, representing an average gain of 100% when measured from the current price.

However, it’s crucial to note that despite this bullish price prediction for BCH, failure to sustain this upward momentum could result in a 30% decline to the $150 horizontal support area.
Such a development would also invalidate the bullish wave count.
Read More: Best Crypto Sign-Up Bonuses in 2023
For BeInCrypto’s latest crypto market analysis, click here.
The post Bitcoin Cash (BCH) Price Reclaims $200 – but Can It Get to $300? appeared first on BeInCrypto.
