The KAS price has increased since August 29, reaching a new all-time high on September 20.
While the price shows signs of a local top, the long-term trend is likely still bullish.
KASPA Price Reaches New All-Time High
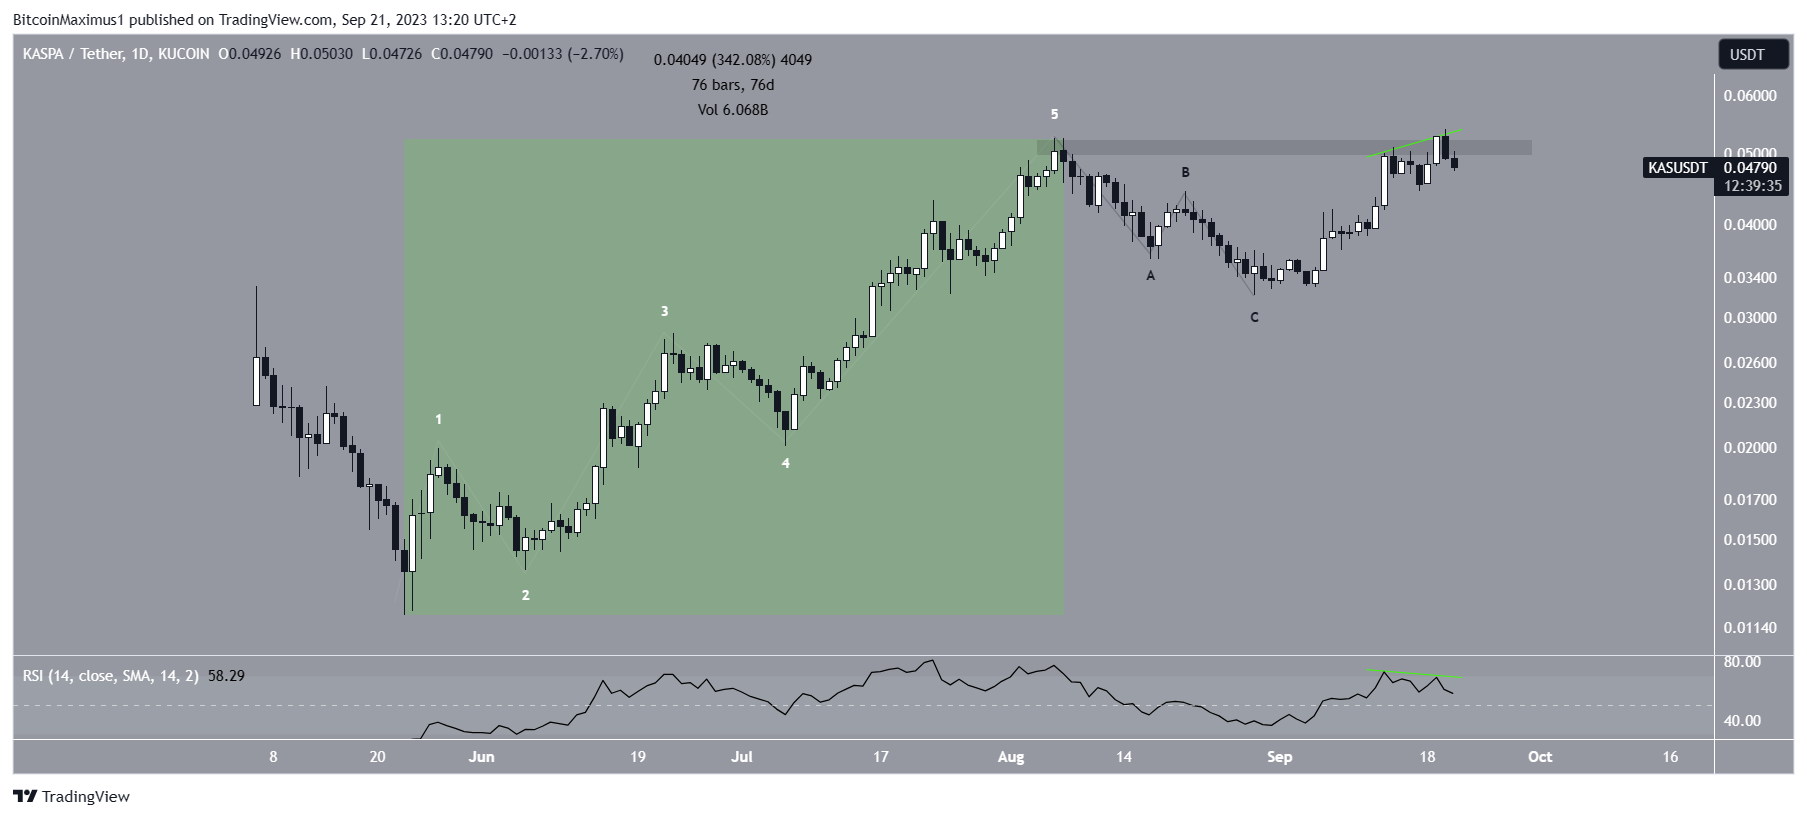
The KAS price has been moving upwards since May 23. Over 76 days, the price increased by 340%, reaching an all-time high of $0.052.
The increase was decisively bullish, showing a clear five-wave upward movement (white). According to the Elliott Wave count, this indicates the trend is bullish. Elliott Wave theory involves the analysis of recurring long-term price patterns and investor psychology to determine the direction of the trend.
Read More: Best Upcoming Airdrops in 2023
After the high, the KAS price fell in what is likely an A-B-C corrective structure (black). This further supports the possibility that the trend is bullish.
The cryptocurrency has increased since and reached a new all-time high of $0.054 on September 20. However, instead of validating the $0.050 area as resistance, KAS fell below it, allowing for the possibility of invalid breakout.
The daily RSI suggests that a decrease is likely, at least in the short term. The RSI is a momentum indicator used by traders to evaluate whether a market is overbought or oversold and to determine whether to accumulate or sell an asset.
Readings above 50 and an upward trend suggest that bulls still have an advantage, while readings below 50 indicate the opposite. While the indicator is above 50, it is falling. Also, it has generated bearish divergence (green line), a sign associated with local and absolute tops.
KAS Price Prediction: Retracement Before Continuation
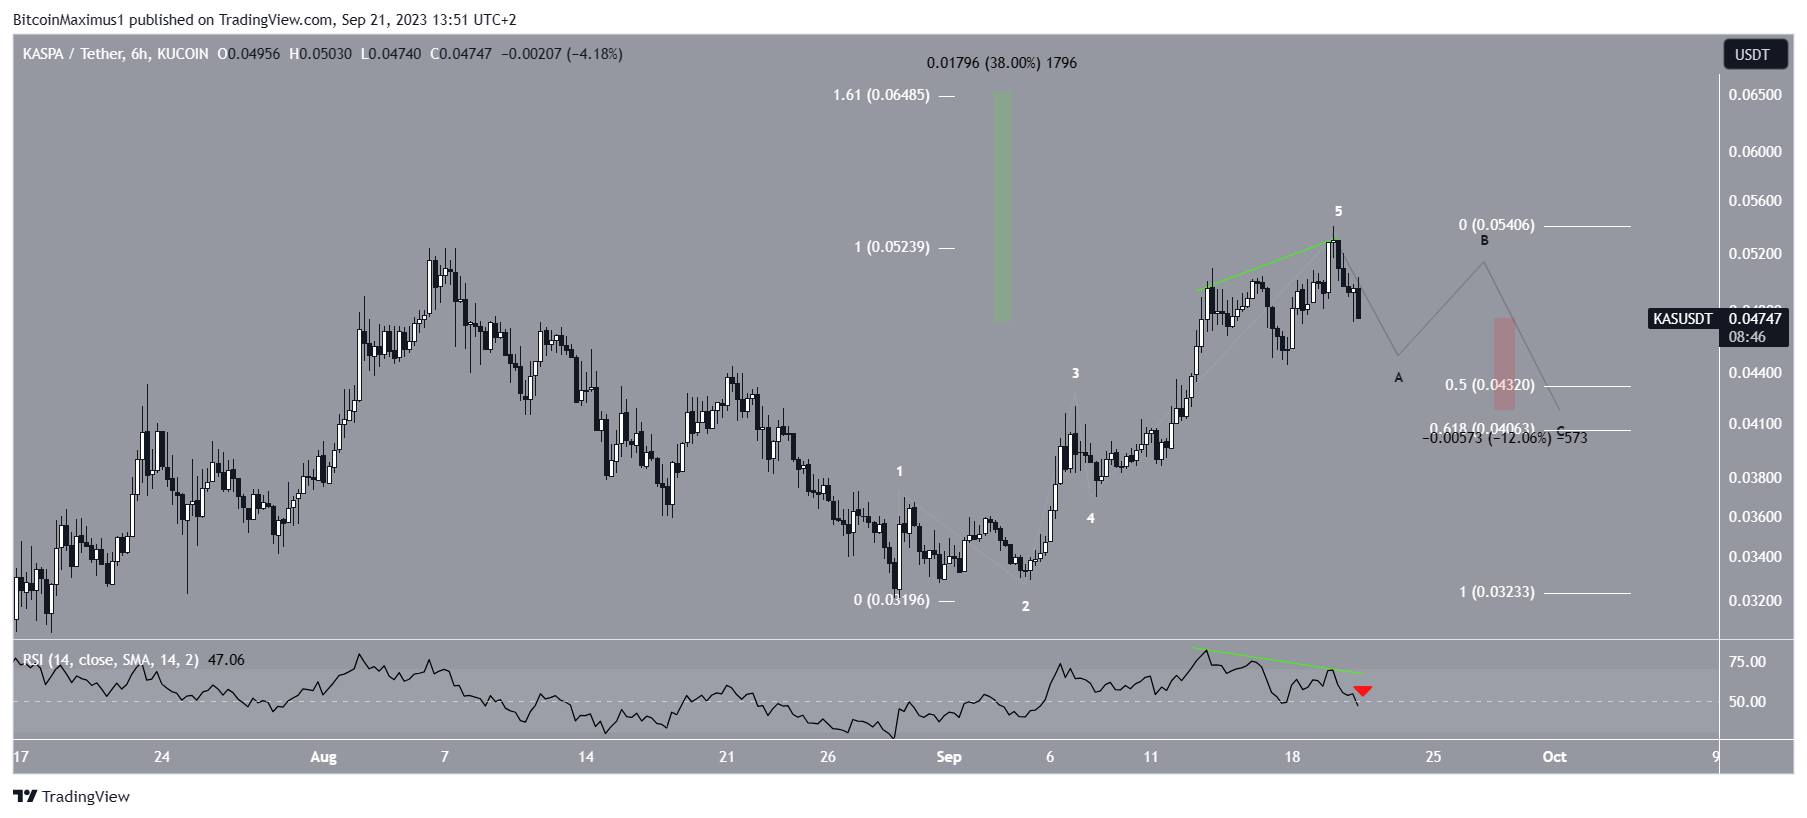
While the daily timeframe analysis can be considered bullish, the six-hour chart suggests that an initial retracement is likely before the increase continues.
The main reason for this is the significant bearish divergence in the RSI (green line). This signifies a loss of momentum and suggests that more downside is expected.
Read More: Best Crypto Sign-Up Bonuses in 2023
Furthermore, the RSI has now fallen below 50 (red icon), a sign of a bearish trend.
The most likely wave count suggests that KAS has completed a five-wave increase and is now correcting in an A-B-C corrective structure (black). The most likely level for this correction to end is between the 0.5-0.618 Fib retracement support levels at $0.040-$0.043. This would be a 12% drop measuring from the current price.
Afterward, an increase toward a new all-time high can occur.

Despite this bearish short-term KAS price prediction, a movement above the current all-time high of $0.054 will mean that the trend is still bullish. In that case, the price can increase to the next high at $0.065, an increase of 40% measuring from the current price.
For BeInCrypto’s latest crypto market analysis, click here.
The post KASPA (KAS) Price Reaches New All-Time High – How Long Will It Continue Increasing? appeared first on BeInCrypto.
