Bitcoin Magazine
Forecasting Bitcoin Price Cycle Peak with the 200-Week Moving Average
As Bitcoin approaches increasingly euphoric territory, the million-dollar question resurfaces of how can we accurately time the cycle’s peak? Most investors either exit too early or ride the market back down after failing to recognize when conditions have shifted. But a deceptively simple tool, the 200-week moving average, may offer critical insights into Bitcoin price trends.
Bitcoin Price Baseline
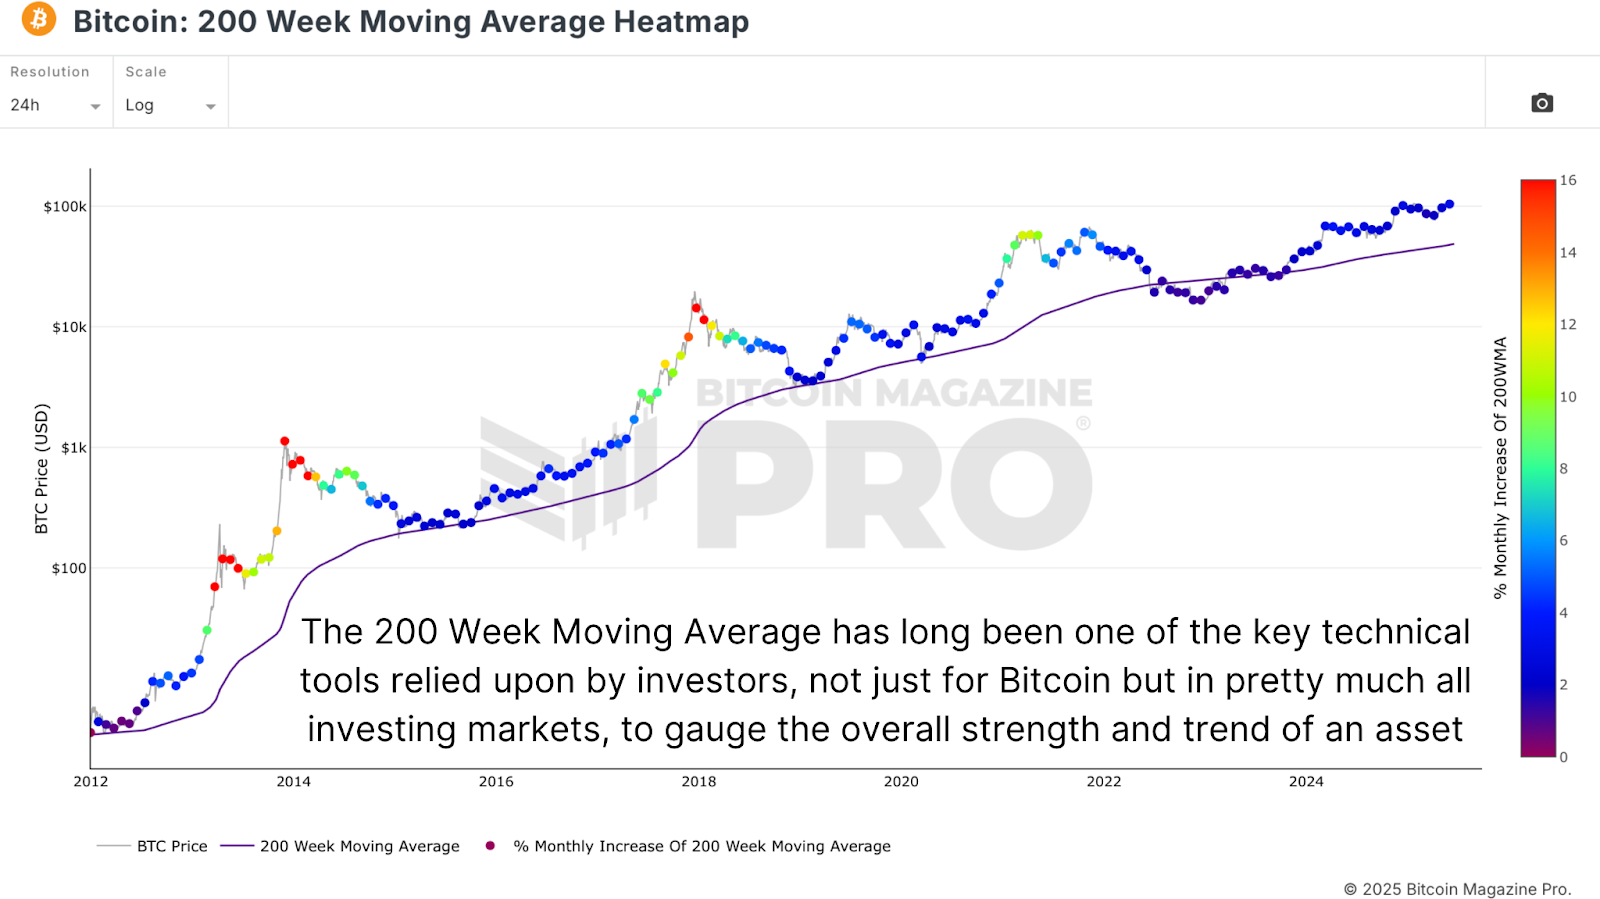
The 200 Week Moving Average Heatmap has long served as one of the most respected technical reference points in Bitcoin analysis. It smooths out noise by calculating the average closing price across the last 200 weekly candles, effectively tracking Bitcoin’s long-term trend. Historically, this moving average has acted as powerful support during bear markets, catching the bottom during the 2015, 2018, and 2022 drawdowns.
More recently, Bitcoin dipped briefly below the 200WMA during the depths of the 2022 bear market, but as price reclaimed this level, it marked the transition back into bullish territory. Today, with Bitcoin well above this moving average once again, many investors are watching how rapidly the 200WMA is rising as an early warning signal for cycle peaks.

While the 200WMA itself provides long-term context, analyzing its growth rate adds further nuance. By measuring the monthly percentage increase of the 200WMA itself, we can build a simple heat map overlay. Historically, when the 200WMA was growing at 14-16% annualized (the orange and red zones), Bitcoin was often near its cycle peaks. However, as Bitcoin’s market cap has grown and volatility has compressed, these extremes have moderated.
In the current cycle, growth rates have so far topped out at around 5-6% (the blue and turquoise zones), with no major push into the yellow or green high-risk zones observed in previous bull runs. This suggests that while Bitcoin has rallied substantially, it has yet to reach the kind of parabolic phase historically associated with blow-off tops.
The Hidden Pattern
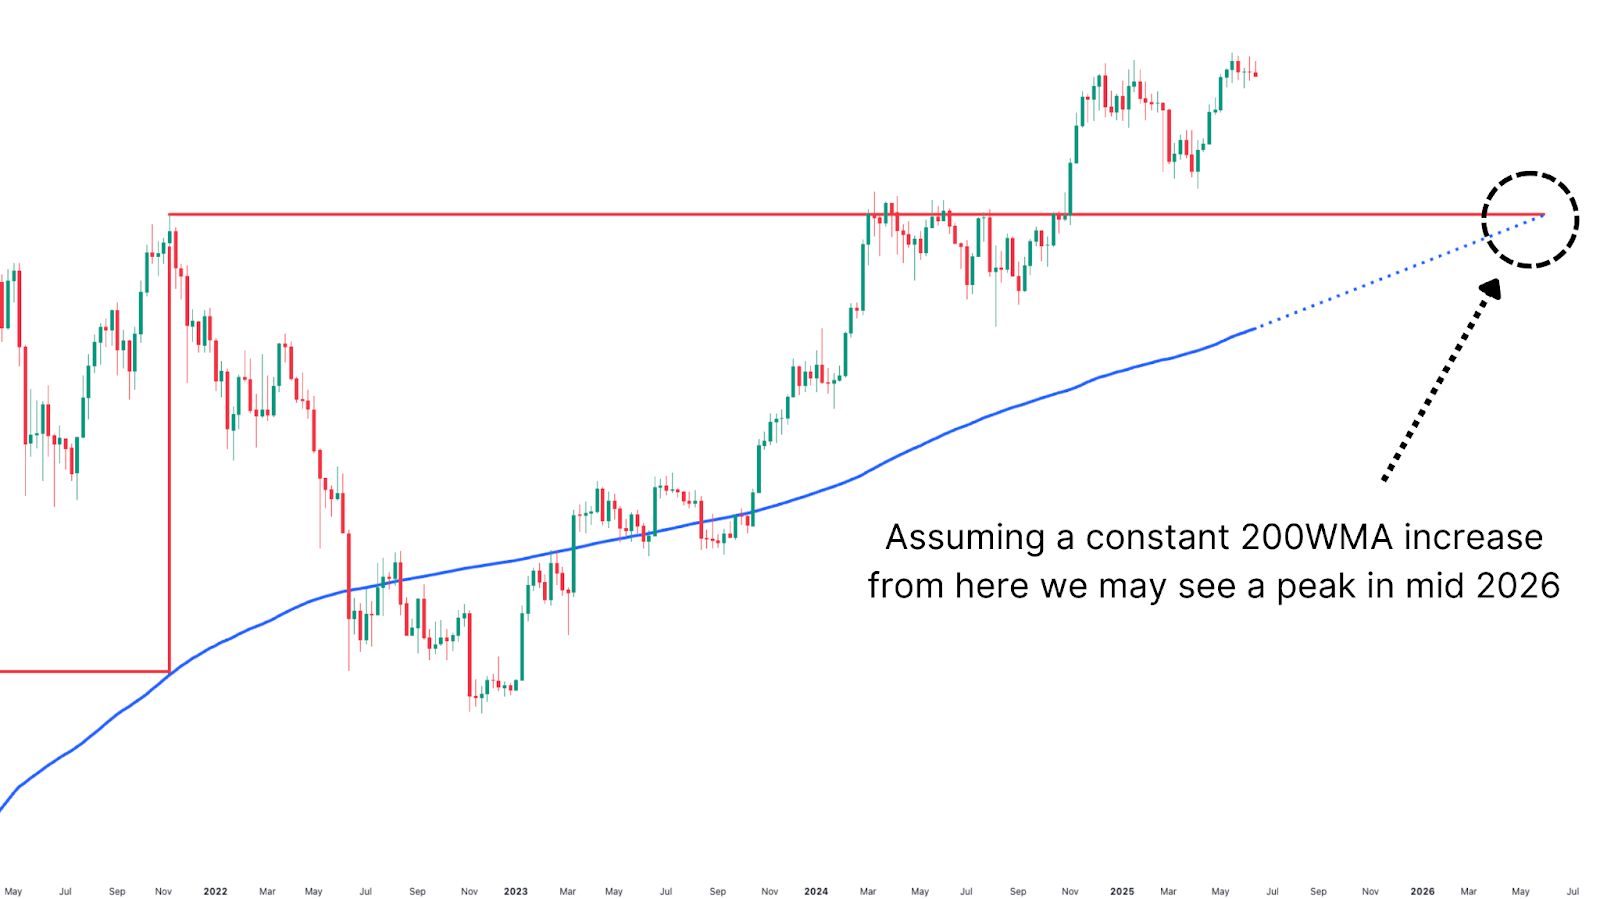
Beyond heat maps, a remarkably consistent pattern has emerged when the 200WMA surpasses its prior all-time high level. Across multiple cycles, when this crossover occurs, Bitcoin has either peaked or come extremely close to peaking in price. This consistency is surprising if this is a mere coincidence. While no model is perfect, the repetitive nature of this signal strongly suggests it deserves close attention as this cycle matures.

Given Bitcoin’s previous all-time high of roughly $69,000, we can attempt to forecast when the 200WMA might next cross this threshold based on its current slope. Assuming a continuation of the average growth rate seen recently, projections suggest this crossover could occur around May or June 2026.

This would represent a significant lengthening of the cycle compared to the 2017 and 2021 tops. If this 2026 scenario plays out, it would mark Bitcoin’s first major break from the historical four-year halving cycle structure.
Diminishing Peaks
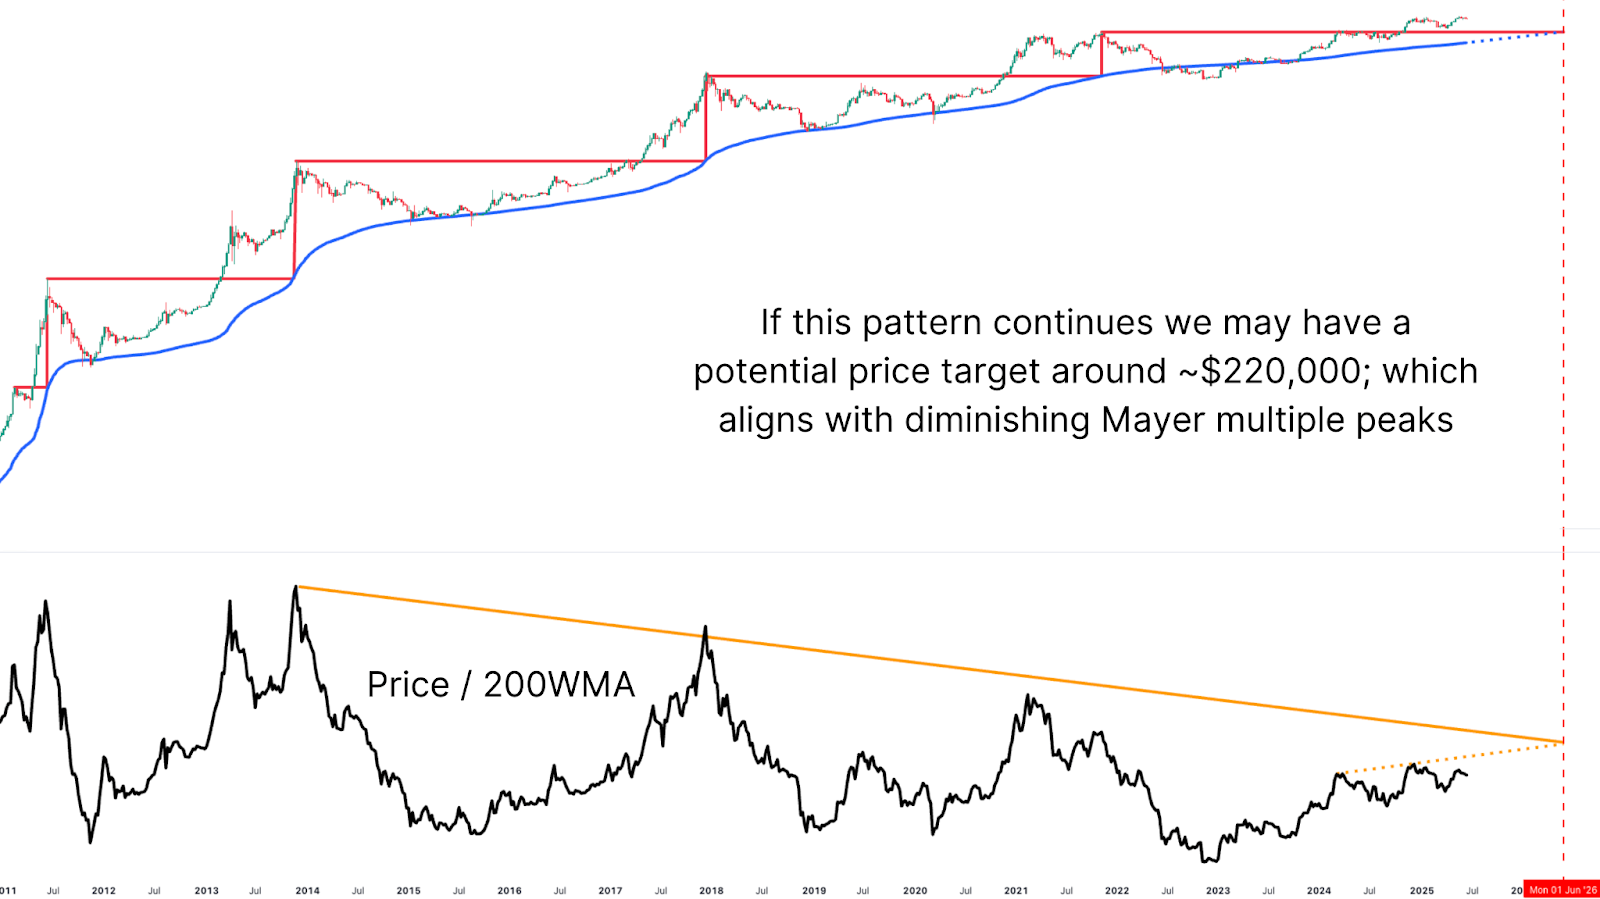
To refine the price forecast further, we can integrate the Mayer Multiple, which measures how far Bitcoin trades above its 200WMA. Historically, peaks have ranged as high as 15x during 2013’s mania, declining to 6x during 2021’s double-top. This downward trend suggests diminishing returns as Bitcoin matures.
Plotting a trendline across the current cycle’s Mayer Multiple highs implies a potential peak multiple of around 3.2 for this cycle. Applying that multiple to a projected 200WMA level of ~$70,000 by mid-2026 yields a theoretical price peak of approximately $220,000.

While a $220,000 Bitcoin may sound aggressive to some, it’s far more reasonable than many of the ultra-optimistic calls for $500k or even $1M during this cycle. The capital inflows required to reach such extreme valuations would likely exceed what’s feasible within the next 12-24 months unless we see unprecedented developments such as nation-state adoption or rapid global reserve accumulation.
That said, the mid-$200k range would still represent a phenomenal outcome for this cycle, one that accommodates both Bitcoin’s maturing market structure and its continued organic growth trajectory.
Conclusion
The 200-week moving average remains one of Bitcoin’s most historically reliable long-term indicators, offering not just support during bear markets but potentially signaling cycle peaks as it crosses previous highs. While the future is inherently uncertain, using these trend-based metrics allows us to approach Bitcoin price projections with a data-driven, probabilistic framework rather than emotionally charged predictions.
If the current trajectory continues, we may be looking at a Bitcoin peak around $220,000 sometime in mid-2026, a scenario that balances bullish optimism with realistic market growth dynamics.
For more deep-dive research, technical indicators, real-time market alerts, and access to a growing community of analysts, visit BitcoinMagazinePro.com.

Disclaimer: This article is for informational purposes only and should not be considered financial advice. Always do your own research before making any investment decisions.
This post Forecasting Bitcoin Price Cycle Peak with the 200-Week Moving Average first appeared on Bitcoin Magazine and is written by Matt Crosby.
