
Reason to trust
Strict editorial policy that focuses on accuracy, relevance, and impartiality
Created by industry experts and meticulously reviewed
The highest standards in reporting and publishing
Strict editorial policy that focuses on accuracy, relevance, and impartiality
Morbi pretium leo et nisl aliquam mollis. Quisque arcu lorem, ultricies quis pellentesque nec, ullamcorper eu odio.
Ethereum is facing a crucial test as bulls and bears lock into a tight battle around the $2,500 level. Despite repeated attempts, bulls have yet to establish control above this key resistance, while bears have been unable to push the price to new lows, signaling an indecisive but increasingly tense standoff. This price compression comes at a time when broader market sentiment is shifting. The US stock market has just reached a new all-time high, and analysts believe crypto could be next to follow.
Related Reading
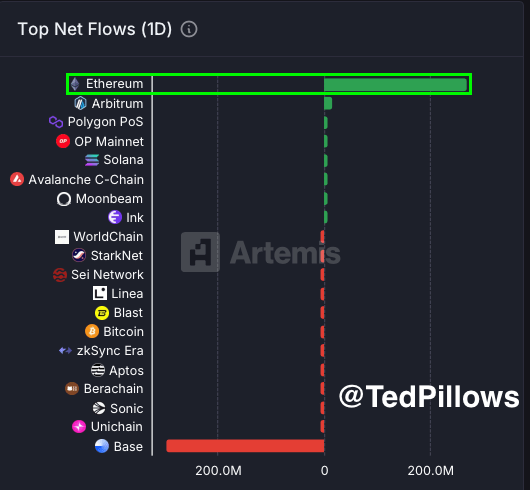
Fueling that optimism is fresh data from Artemis showing that Ethereum recorded over $269 million in net inflows in the past 24 hours. This sharp increase in capital moving into ETH reflects renewed investor confidence and may act as a catalyst for further price action. As global liquidity trends upward and risk appetite returns, Ethereum continues to gain momentum.
Still, the $2,500 level remains a major hurdle. A confirmed breakout above it could trigger a sharp move higher, potentially leading the way for altcoin recovery. Until then, ETH traders remain on alert, watching for either a clean breakout or another rejection in what could be a defining moment for Ethereum’s mid-term direction.
Ethereum Builds Strength As Altseason Awaits Breakout
Ethereum has been consolidating in a broad range, trading between $2,200 and $2,800 for several weeks. This tight band of price action reflects a broader indecisiveness across the altcoin market, with traders still waiting for a definitive breakout to kickstart the long-anticipated altseason. Despite occasional surges in momentum, ETH has yet to break above the $2,800 mark—a level that could open the door for sustained upside and renewed altcoin activity across the board.
The macroeconomic environment remains a wildcard. With mixed inflation data, geopolitical risks, and a volatile interest rate outlook, markets are reacting cautiously. Yet, amid this backdrop, Ethereum continues to show resilience. Many analysts believe that once ETH breaks out of this range, it could act as the trigger for a broader altcoin rally.
Adding to the bullish outlook is fresh data shared by top analyst Ted Pillows, who highlighted a significant shift in investor behavior. According to Pillows, Ethereum saw over $269 million in net inflows in the last 24 hours, signaling renewed demand from institutional and retail players alike. These inflows, tracked by Artemis, point to growing confidence and could serve as the foundation for Ethereum’s next leg higher.
While uncertainty lingers, momentum is quietly building. Ethereum’s ability to hold above $2,200 and attract capital during macro headwinds suggests strength beneath the surface. For altseason to truly ignite, ETH must break out of its current range and push decisively into higher territory. Until then, traders and investors continue to watch closely, knowing that once the breakout happens, it could shift the entire market cycle forward.
Related Reading
ETH Consolidates Below 200-Day SMA
Ethereum is currently trading at $2,427, consolidating below the key 200-day simple moving average (SMA) at $2,544. After bouncing off support near $2,200 earlier this month, ETH has managed to hold above the 100-day SMA ($2,167) and regain some structure. However, the price remains capped by a cluster of resistance levels, including the 50-day SMA ($2,534) and the 200-day SMA, both of which are converging near $2,540—a critical zone for bulls to reclaim.
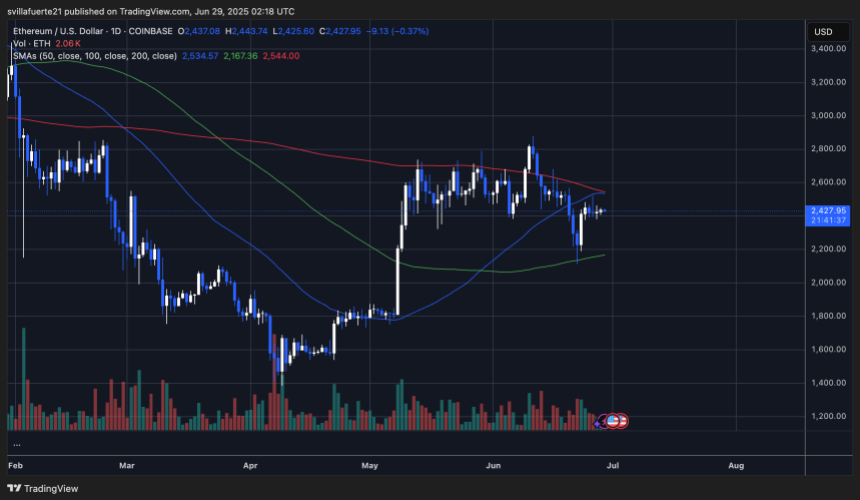
The chart shows that Ethereum has been trading within a broad range between $2,200 and $2,800 for several weeks, reflecting indecision in the market. The failure to break through the $2,800 zone earlier in June has kept ETH in a sideways pattern. Volume has also declined, suggesting caution among traders as ETH tests this tight band of resistance.
Related Reading
A strong daily close above the $2,540–$2,550 region could confirm a bullish breakout and reignite momentum toward the $2,800 level. On the downside, a drop below $2,300 would weaken the current setup and expose Ethereum to further losses.
Featured image from Dall-E, chart from TradingView