Since April, the Chainlink (LINK) price has fallen under a descending resistance trendline.
During this time, the Relative Strength Index movement has been especially prescient in determining the Chainlink price volatility.
Will Chainlink Reach New Yearly High?
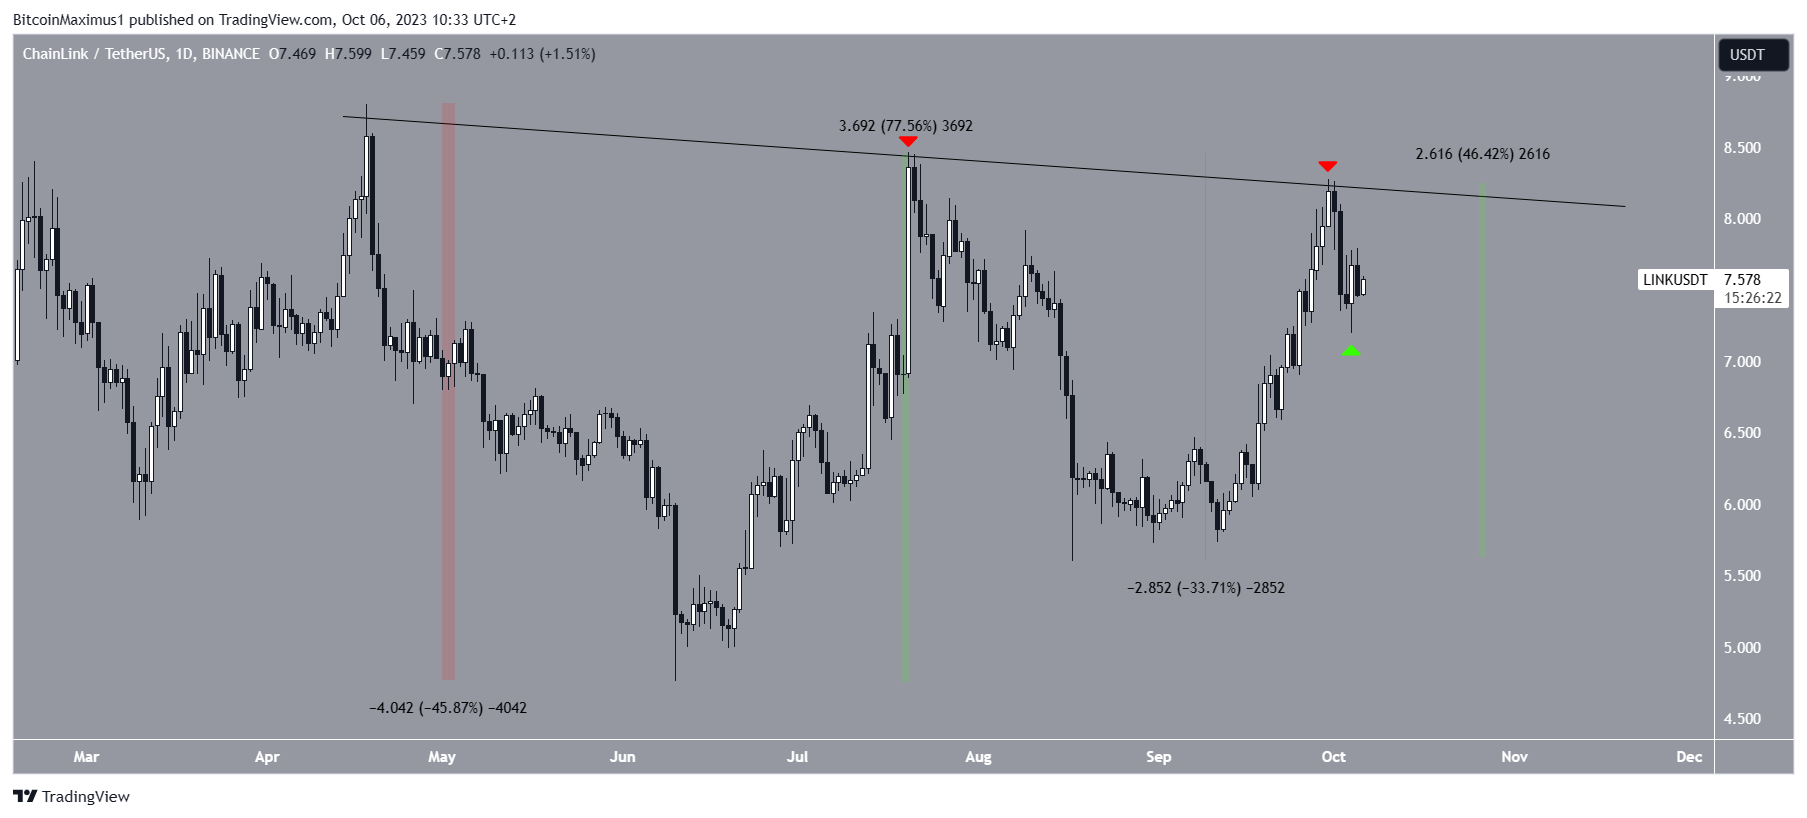
The daily timeframe technical analysis shows that the LINK price has experienced significant volatility since April.
During this time, it has seen drops of 46% and 33% (red) and increases of 77% and 46%, respectively.
Empower your investments with LINK price predictions.
LINK has also fallen under a descending resistance trendline throughout this period. The trendline caused two rejections on July 20 and September 30, respectively (red icons).
The first rejection catalyzed a 33% decrease, while the second one only led to a slight retracement.
After falling to a low of $7.20, LINK created a bullish, engulfing candlestick with a long lower wick (green icon). This type of candlestick negates all of the losses from the previous period.
The long lower wick shows buyers stepped in quickly, ending the previous decrease.
In the news, Chainlink co-founder Sergey Nazarov stated that banks are disadvantaged regarding blockchain adoption.
The reason for this is that they already have a substantial investment in the SWIFT infrastructure, which complicates the blockchain adoption process.
Read More: 6 Best Copy Trading Platforms in 2023
Chainlink Price Prediction: Will Volatility Return in October?
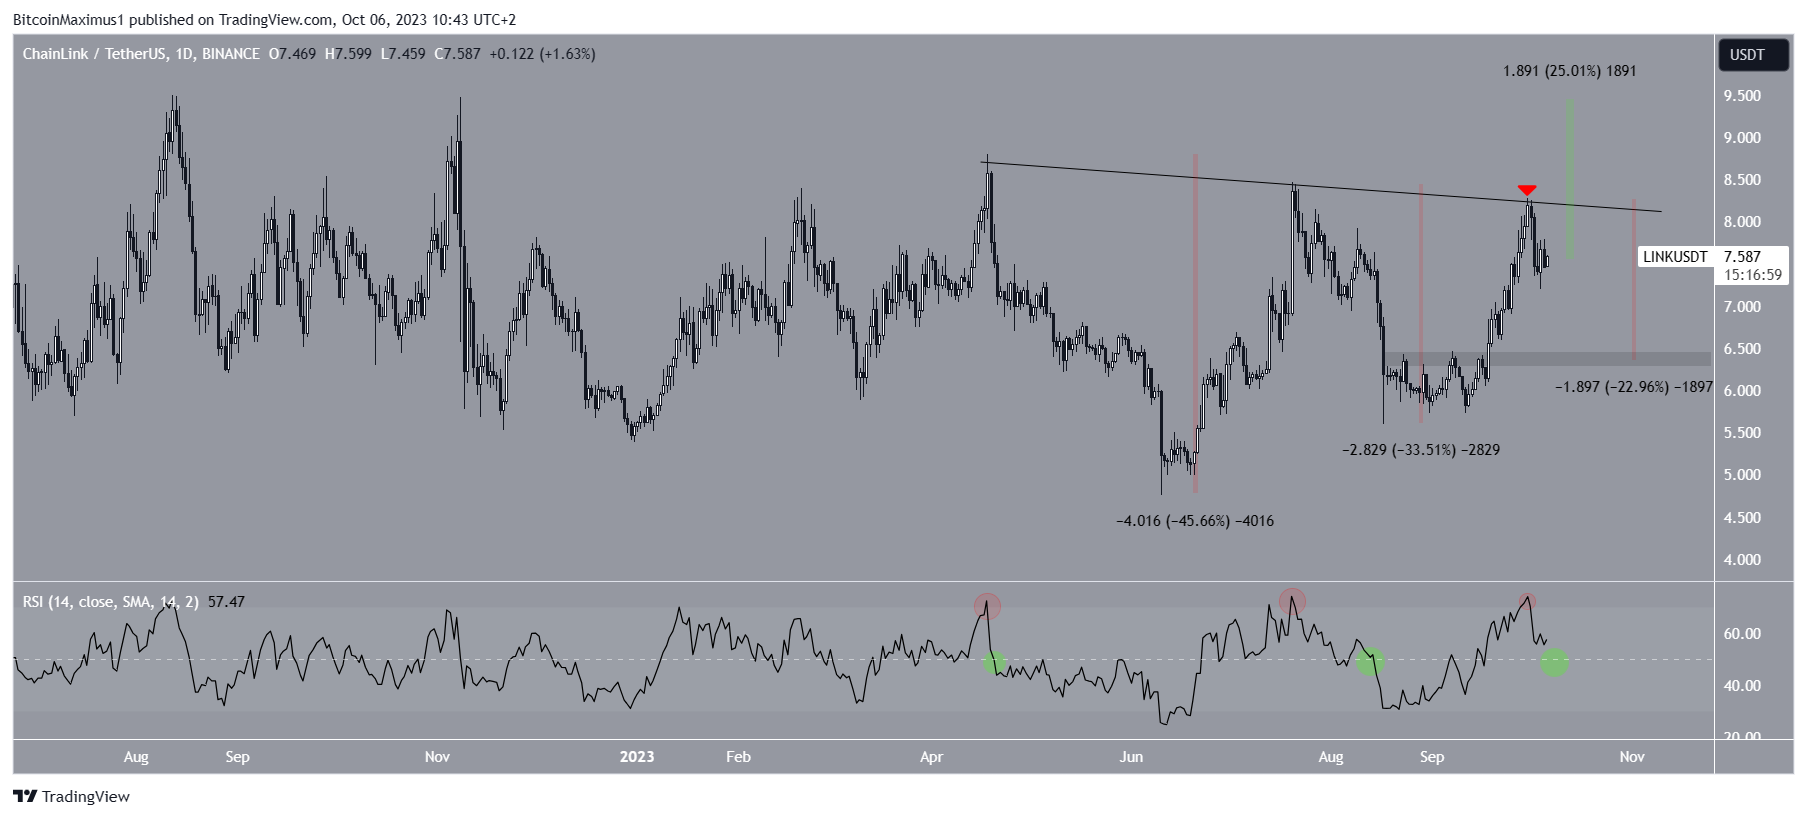
The daily time frame RSI can be used to determine the future trend. The RSI is a popular metric among traders for gauging momentum and informing their buy or sell decisions on assets.
Bulls have an advantage if the RSI reading is above 50 and the trend is upward. The opposite is true if the reading is below 50.
The indicator shows that the 46% and 33% Chainlink price decreases occurred after the daily RSI reached overbought territory (red circle).
With this in mind, the RSI also reached overbought territory on September 30. This coincided with the rejection of the resistance trendline (red icon). So far, it has led to an 8% drop.
An interesting signal comes from the RSI’s relationship to the 50 trendline. In both previous decreases, the downward movement was confirmed only after the RSI broke down below 50 (green circle). This has not occurred yet in the current decrease.
It is also worth mentioning that the Chainlink exchange supply hit a 15-month low on October 3. Historically, shortages like these have driven price increases.

So, the future LINK price prediction can be determined by whether the RSI breaks down below 50 or bounces. A breakdown could lead to a 23% drop to $6.35.
If the RSI bounces, the altcoin will likely break out from the long-term descending resistance trendline. In that case, a 25% increase to the next resistance at $2.45 will be likely.
Read More: How To Make Money in a Bear Market
For BeInCrypto’s latest crypto market analysis, click here.
The post Chainlink (LINK) Price Bullish or Bearish? This Key Trading Indicator Provides Insight appeared first on BeInCrypto.
