
Sellers are more powerful than buyers in the middle of the week, according to CoinStats.
XRP/USD
The rate of XRP has fallen by 0.41% over the last 24 hours.
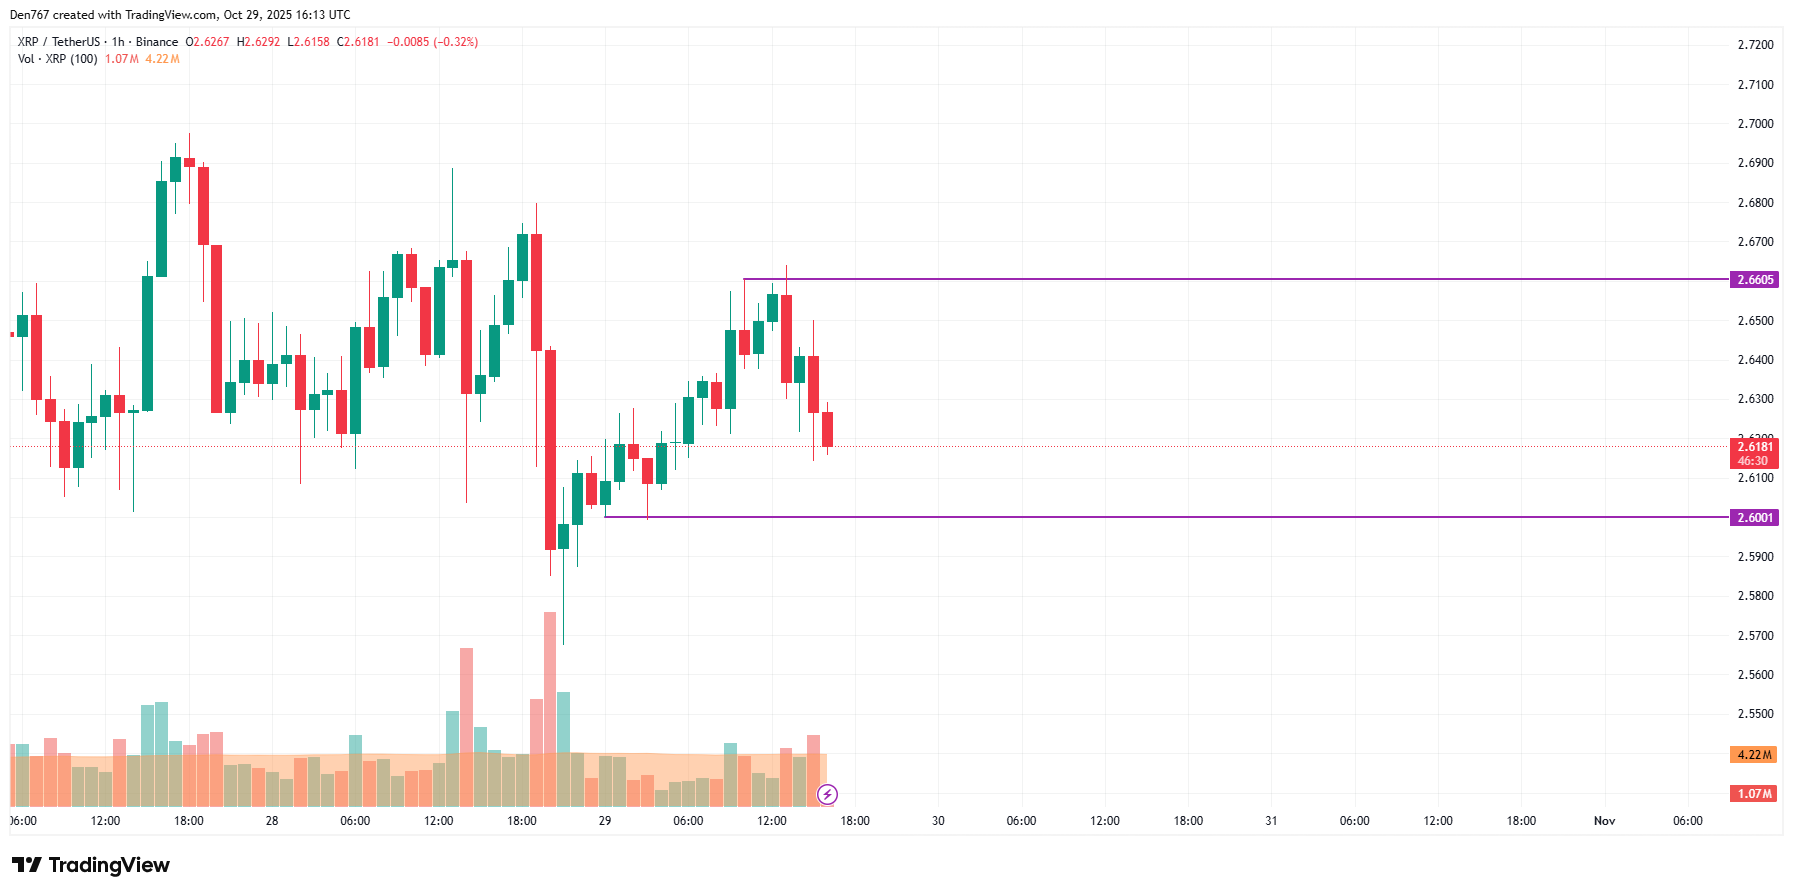
On the hourly chart, the price of XRP is going down after a false breakout of the local resistance of $2.6605. If bulls cannot seize the initaitive, one can expect a test of the support by tomorrow.
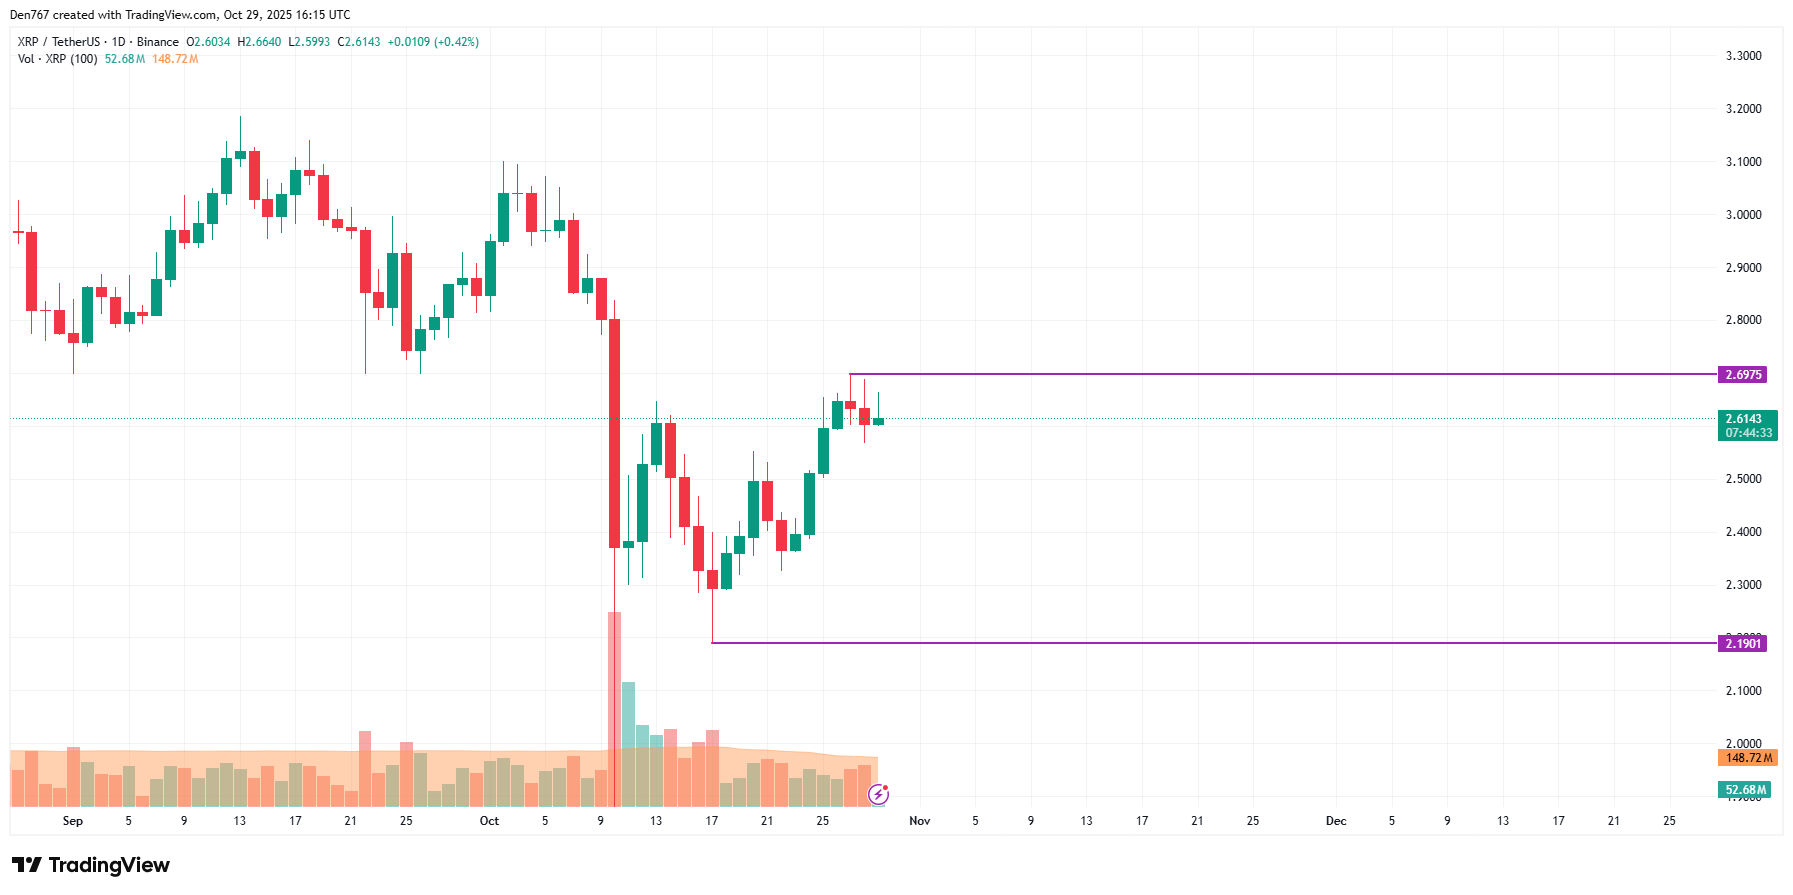
On the longer time frame, the picture is also more bearish than bullish. If the daily bar closes around current prices or below them, the drop is likely to continue to the $2.50-$2.55 range shortly.
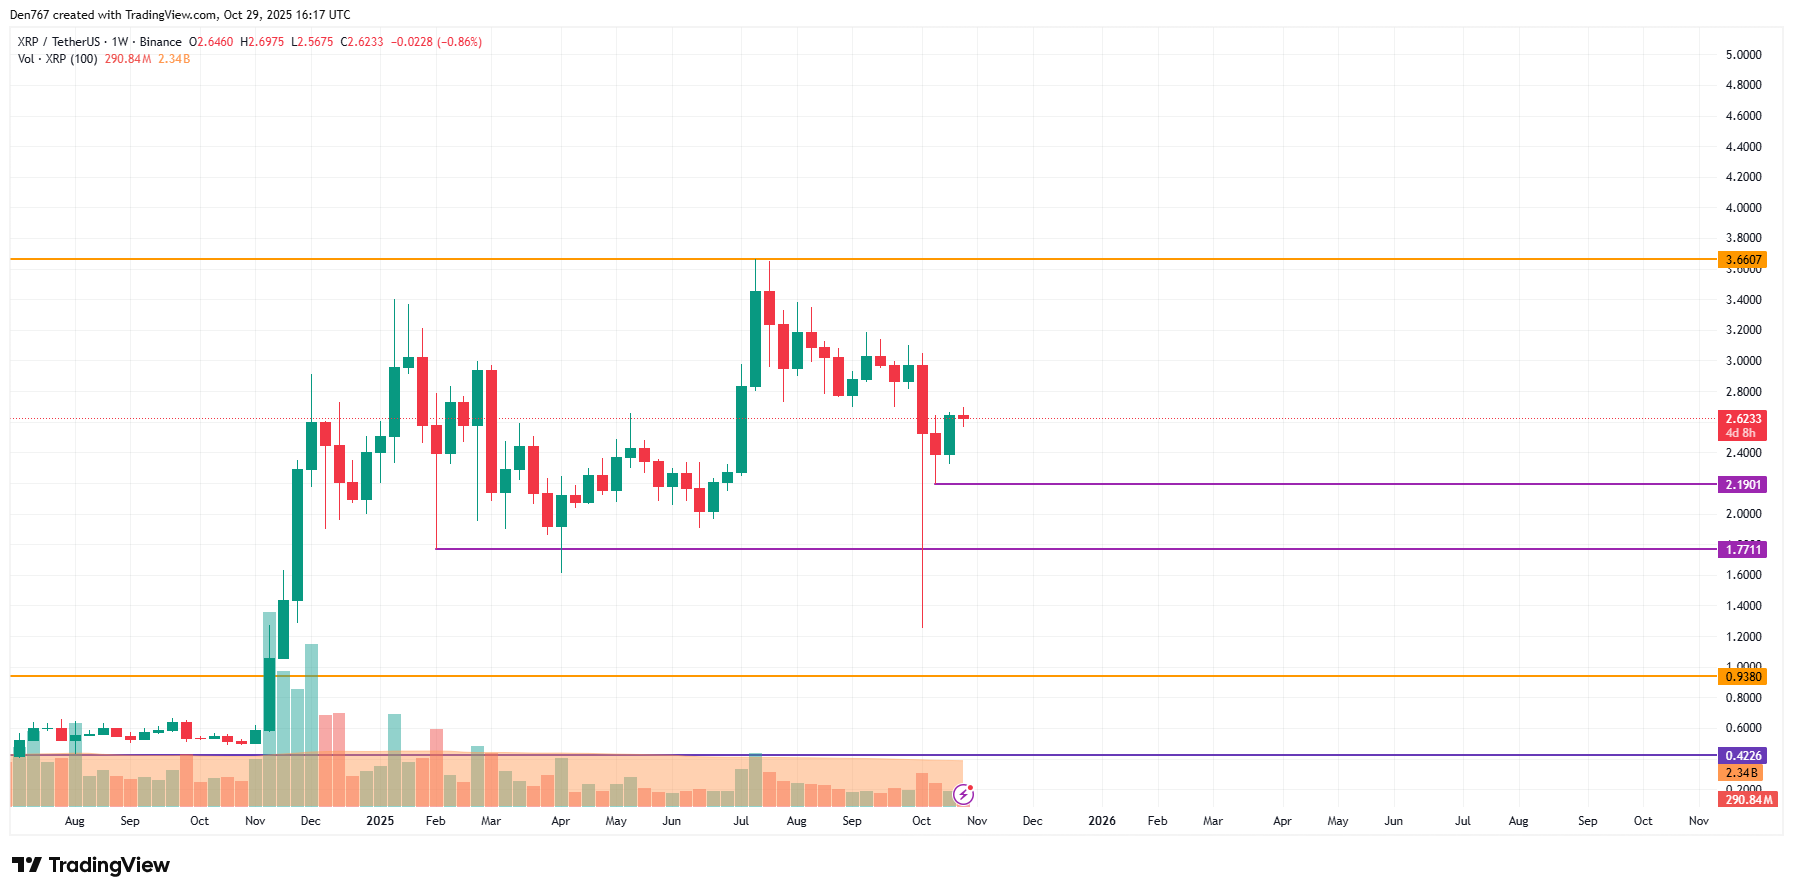
From the midterm point of view, none of the sides is dominating, as the rate is far from key support and resistance levels.
You Might Also Like

Thus, the volume is low, which means there are low chances of seeing sharp moves by the end of the week.
XRP is trading at $2.6201 at press time.