
Bitcoin price is hovering near $105,300, down about 0.8% in the past 24 hours and roughly 5% this month. Yet, this week looks surprisingly stable. After briefly dipping near $100,000, Bitcoin has managed to rebound — even as sell pressure rises sharply.
That contrast between rising selling pressure and relatively steady prices suggests something deeper happening under the surface.
Data Shows Surge in Selling Pressure By Over 1,300%
On-chain data from spent output by age bands — which tracks how old coins being moved to exchanges are — reveals a sharp spike in BTC selling.
Short-term holders (1-day to 1-week wallets) have raised their exchange transfers from 470 BTC on November 8 to 6,695 BTC on November 10, marking a 1,300+% surge.
At the same time, mid-term holders (6-month to 1-year wallets) increased their exchange inflows from 268 BTC to 1,125 BTC. That’s an almost 300% surge in selling pressure. This rise shows that both short- and mid-term investors are taking profits, often a sign of fading confidence or profit-taking at resistance zones.
Want more token insights like this? Sign up for Editor Harsh Notariya’s Daily Crypto Newsletter here.
Usually, such a rise in exchange inflows pressures prices down. But this time, the market has held its ground — hinting at fresh demand stepping in to offset the sell orders.
Looming Bullish Crossover Signal Suggests a Rebound Could Strengthen
On the short-term chart, a technical signal supports this resilience. The Exponential Moving Average (EMA), which smooths out price data to identify trend direction faster than a standard moving average, now shows an emerging bullish crossover. The 20-period EMA is closing in on the 50-period EMA, and when the shorter EMA crosses above the longer one, it often signals strengthening momentum.
The last time this pattern appeared — around October 25 — Bitcoin rallied over 5% within days.
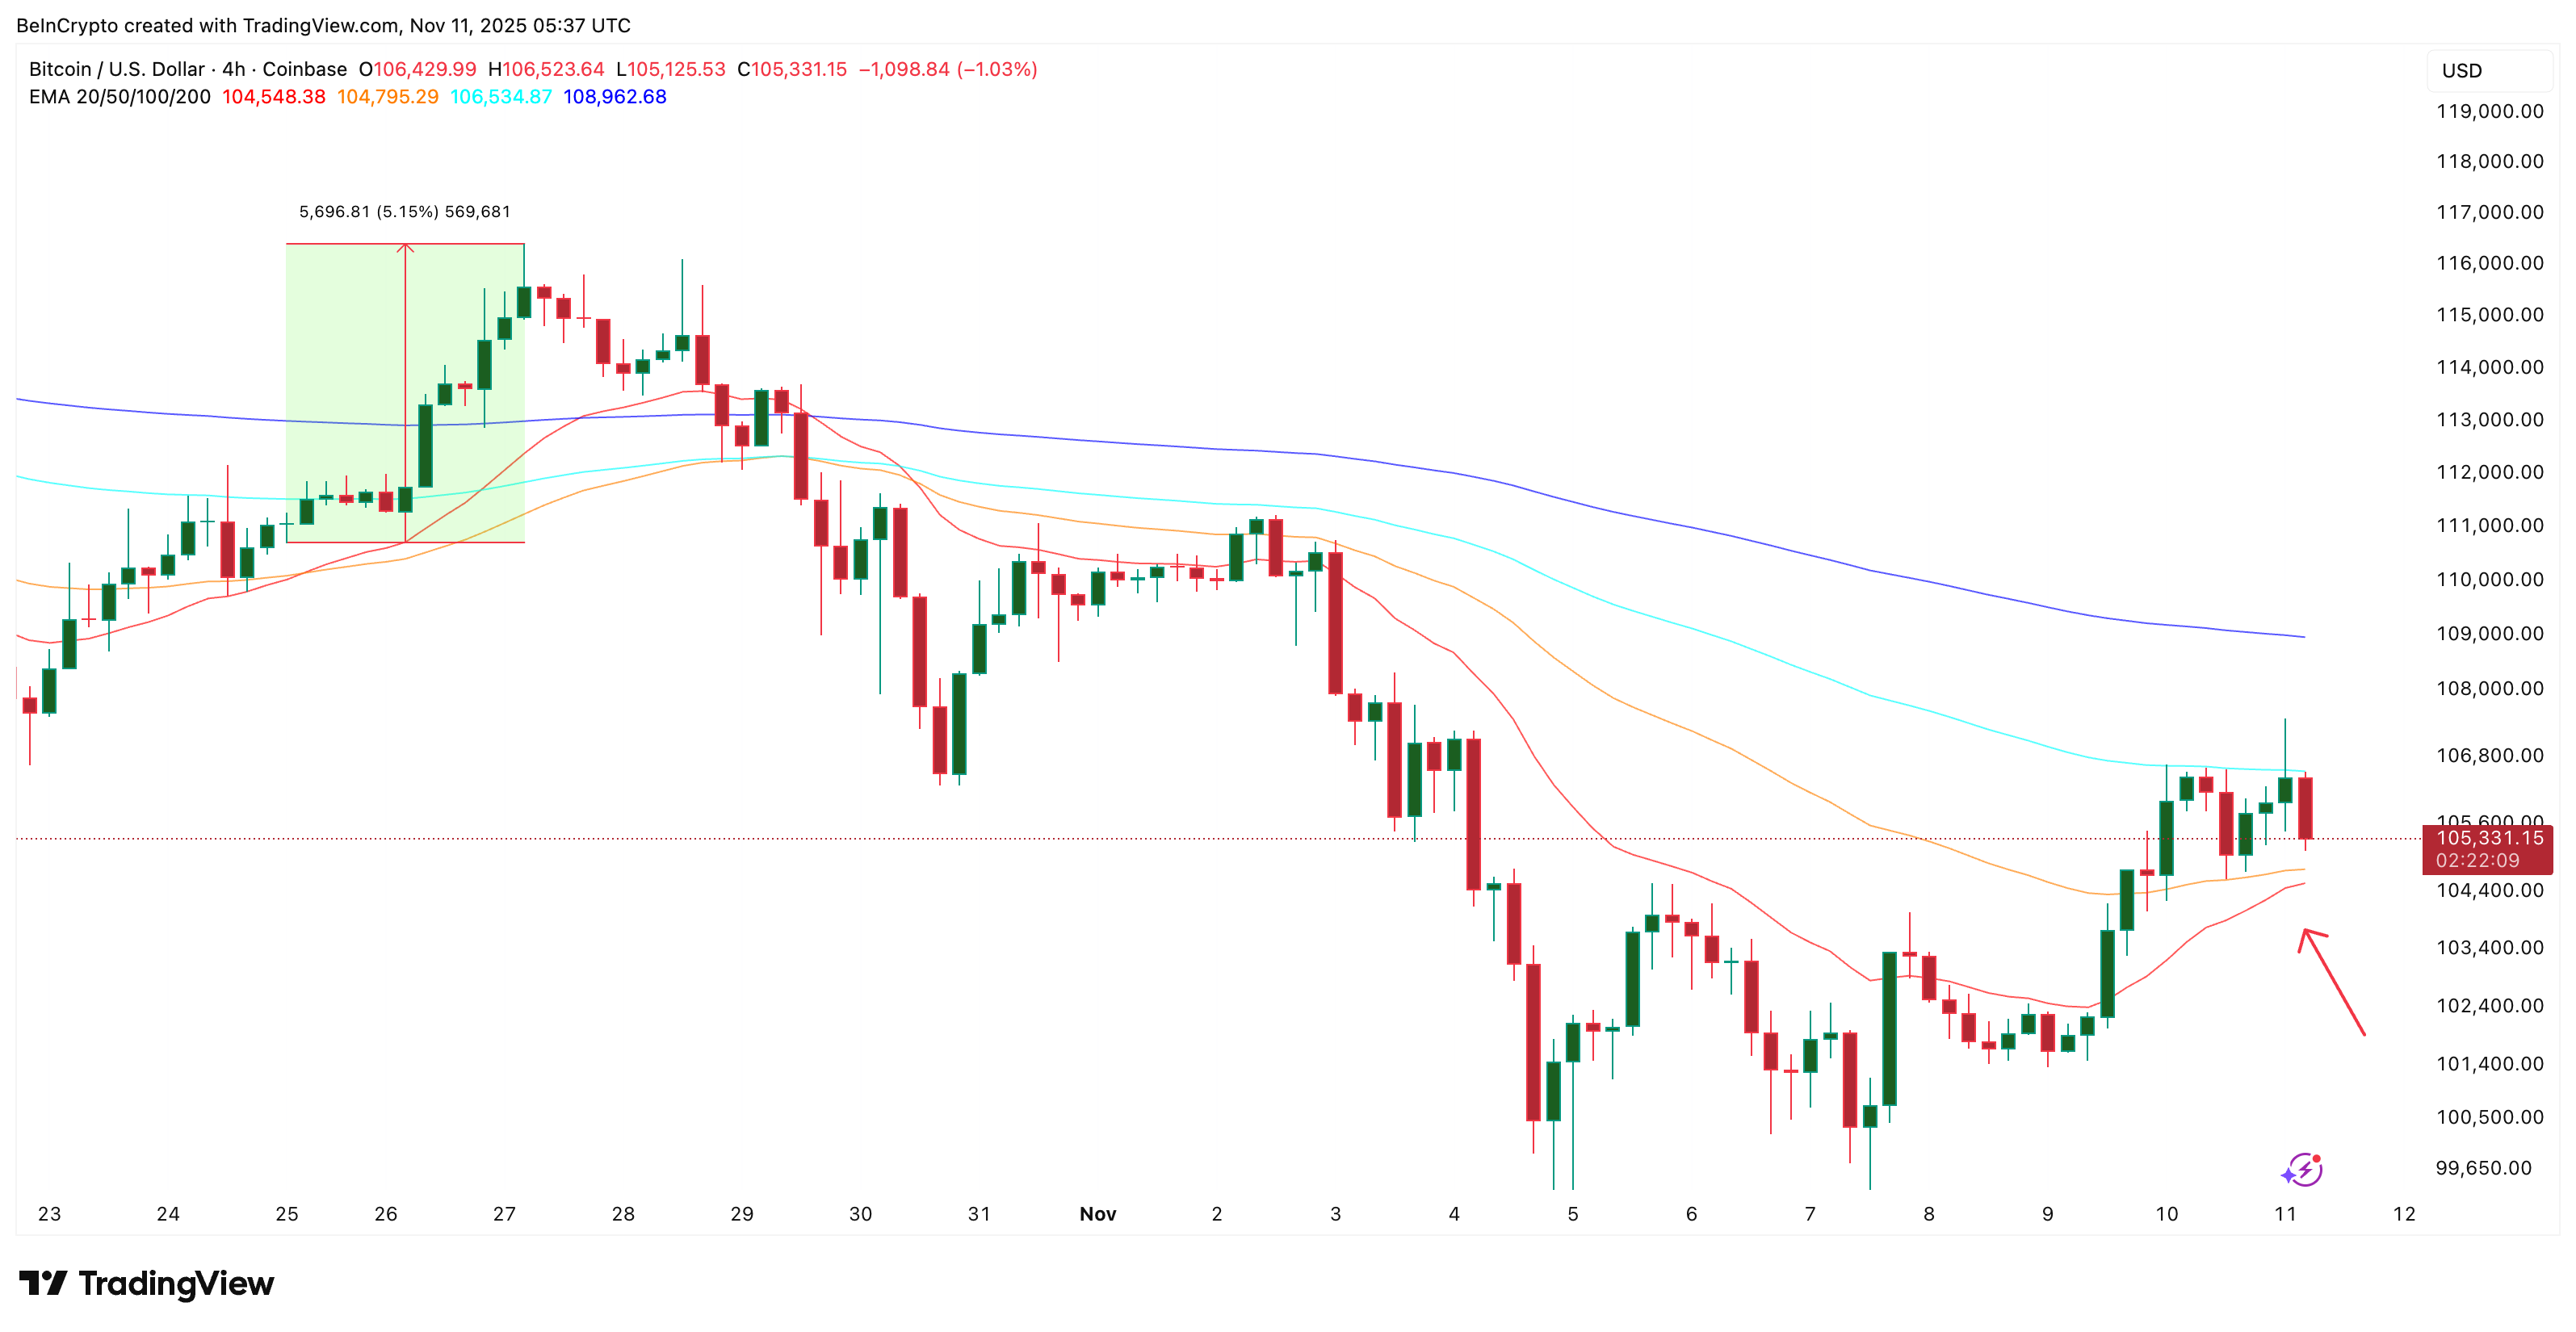
This suggests that despite the heavy selling, the underlying momentum might be recovering again. Traders are watching closely to see if this crossover completes, as it would confirm that buying pressure is building beneath the surface.
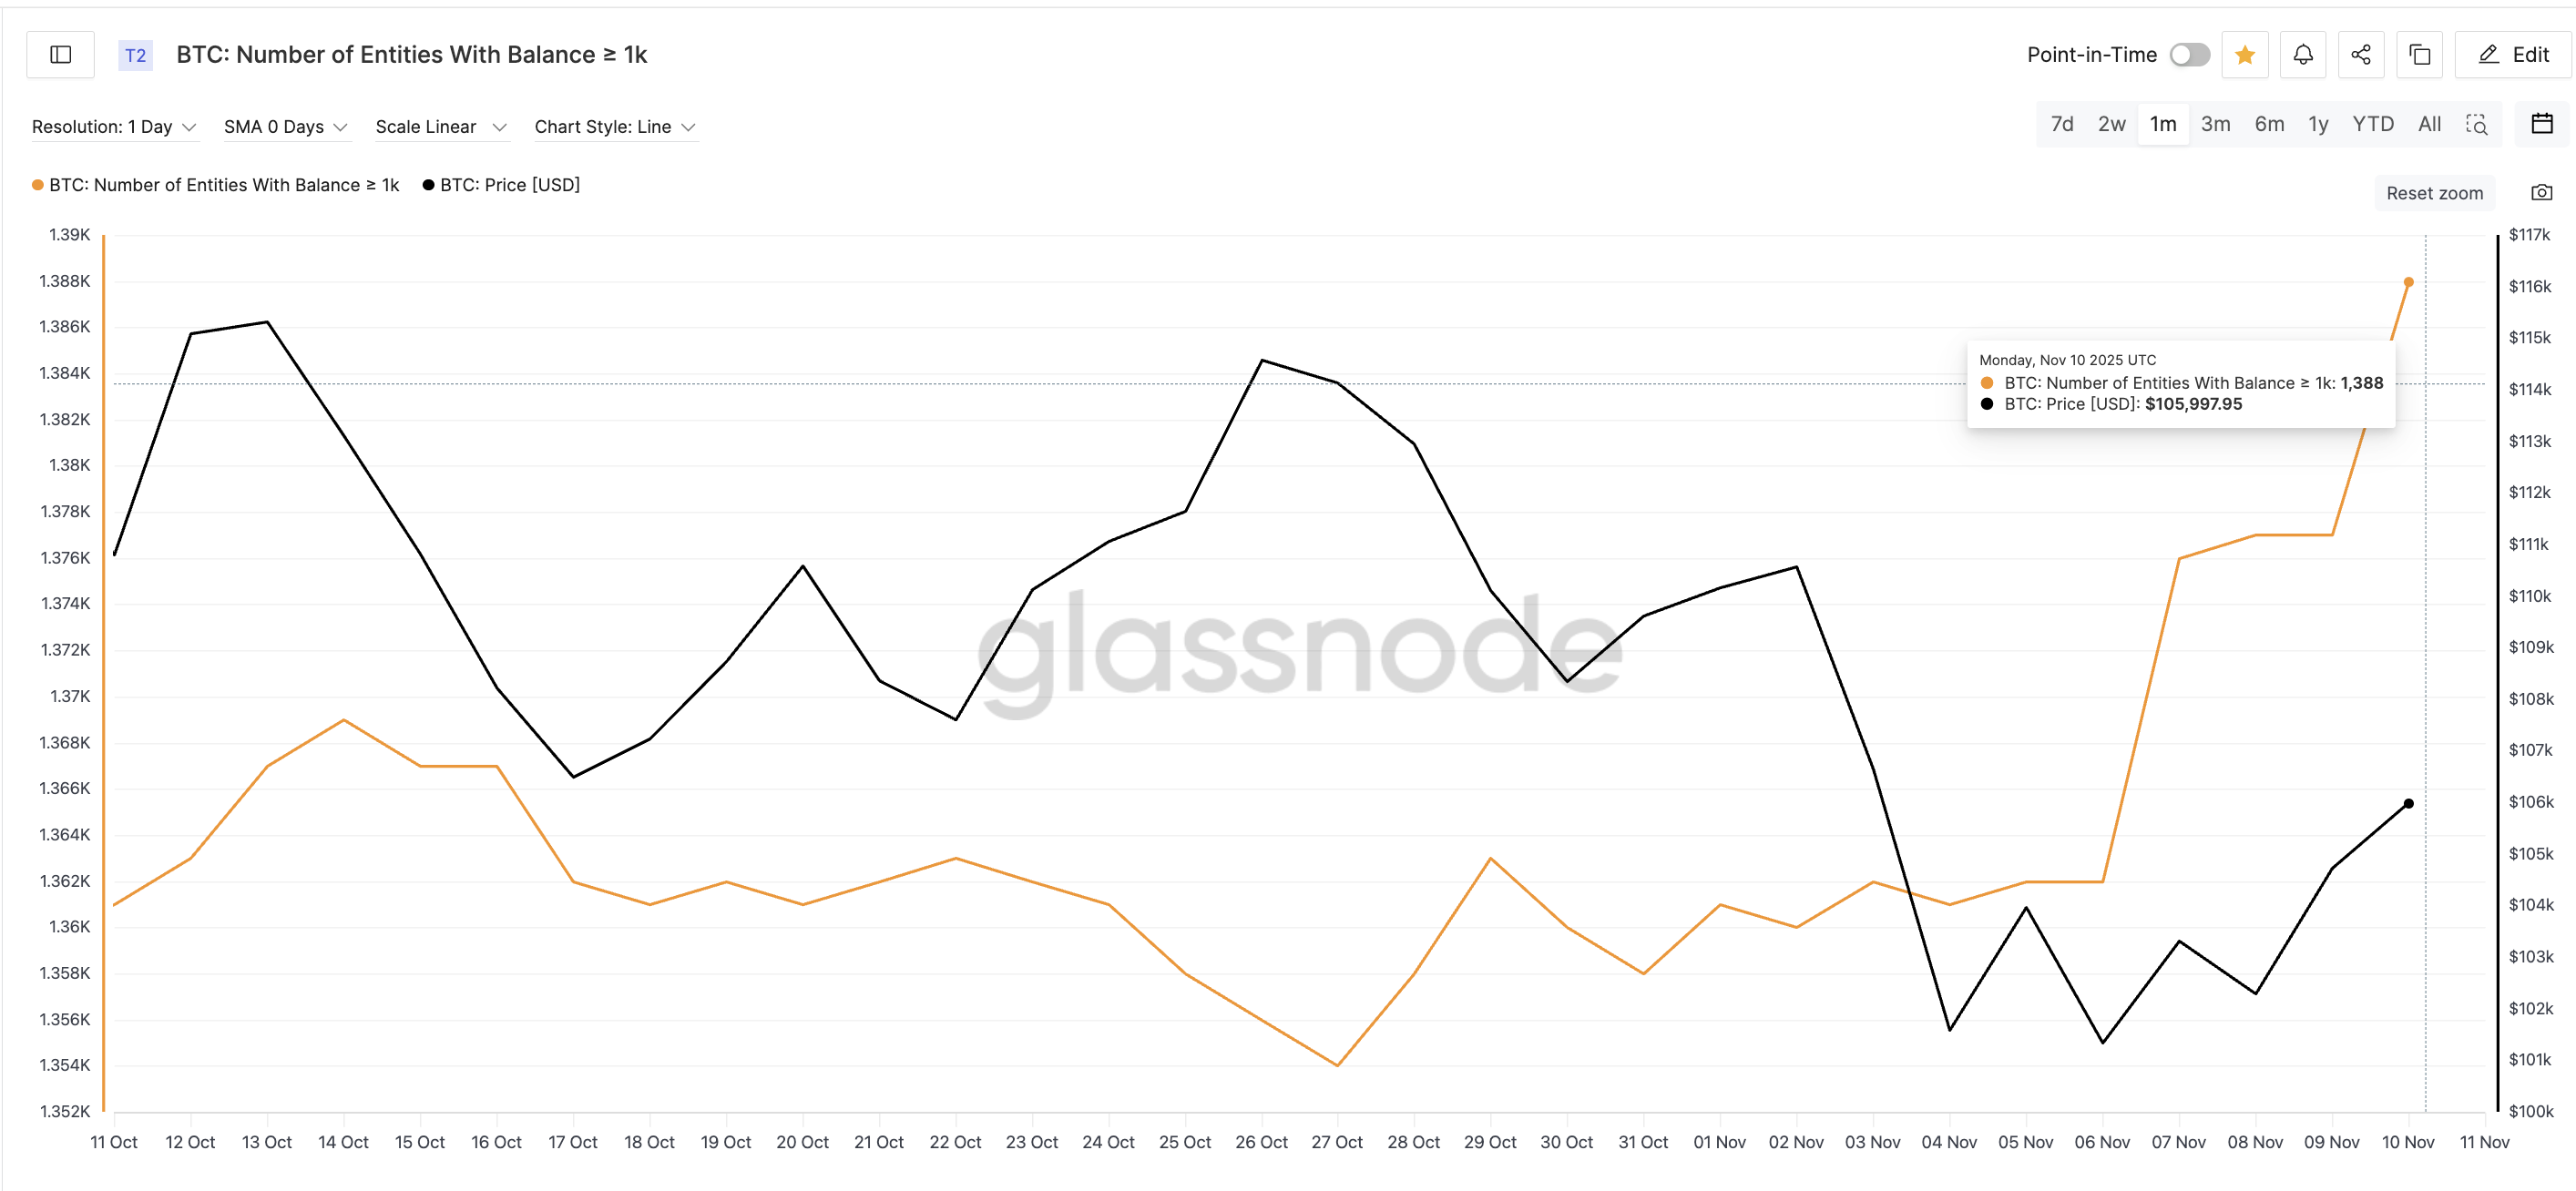
Large Holders Step In as Key Bitcoin Price Levels Define the Next Move
Supporting the rebound thesis, whale wallet data shows an uptick in accumulation. Entities holding over 1,000 BTC rose from 1,362 to 1,388 between November 6 and 10, an increase of about 1.9%.
At the current price, that implies over 26,000 BTC (roughly $2.7 billion) added to large wallets — enough to absorb a meaningful share of short-term selling.
If this accumulation continues, it could sustain Bitcoin’s rebound and help retest key resistance levels. The first test sits at $105,500 — a zone that has rejected moves since November 9.
A clean daily close above that could open the door to $109,700, which has capped Bitcoin rallies since October 31. Beyond that, targets include $112,600 and $116,400. However, that kind of Bitcoin price move would need continued whale attention and eased cohort-based selling.
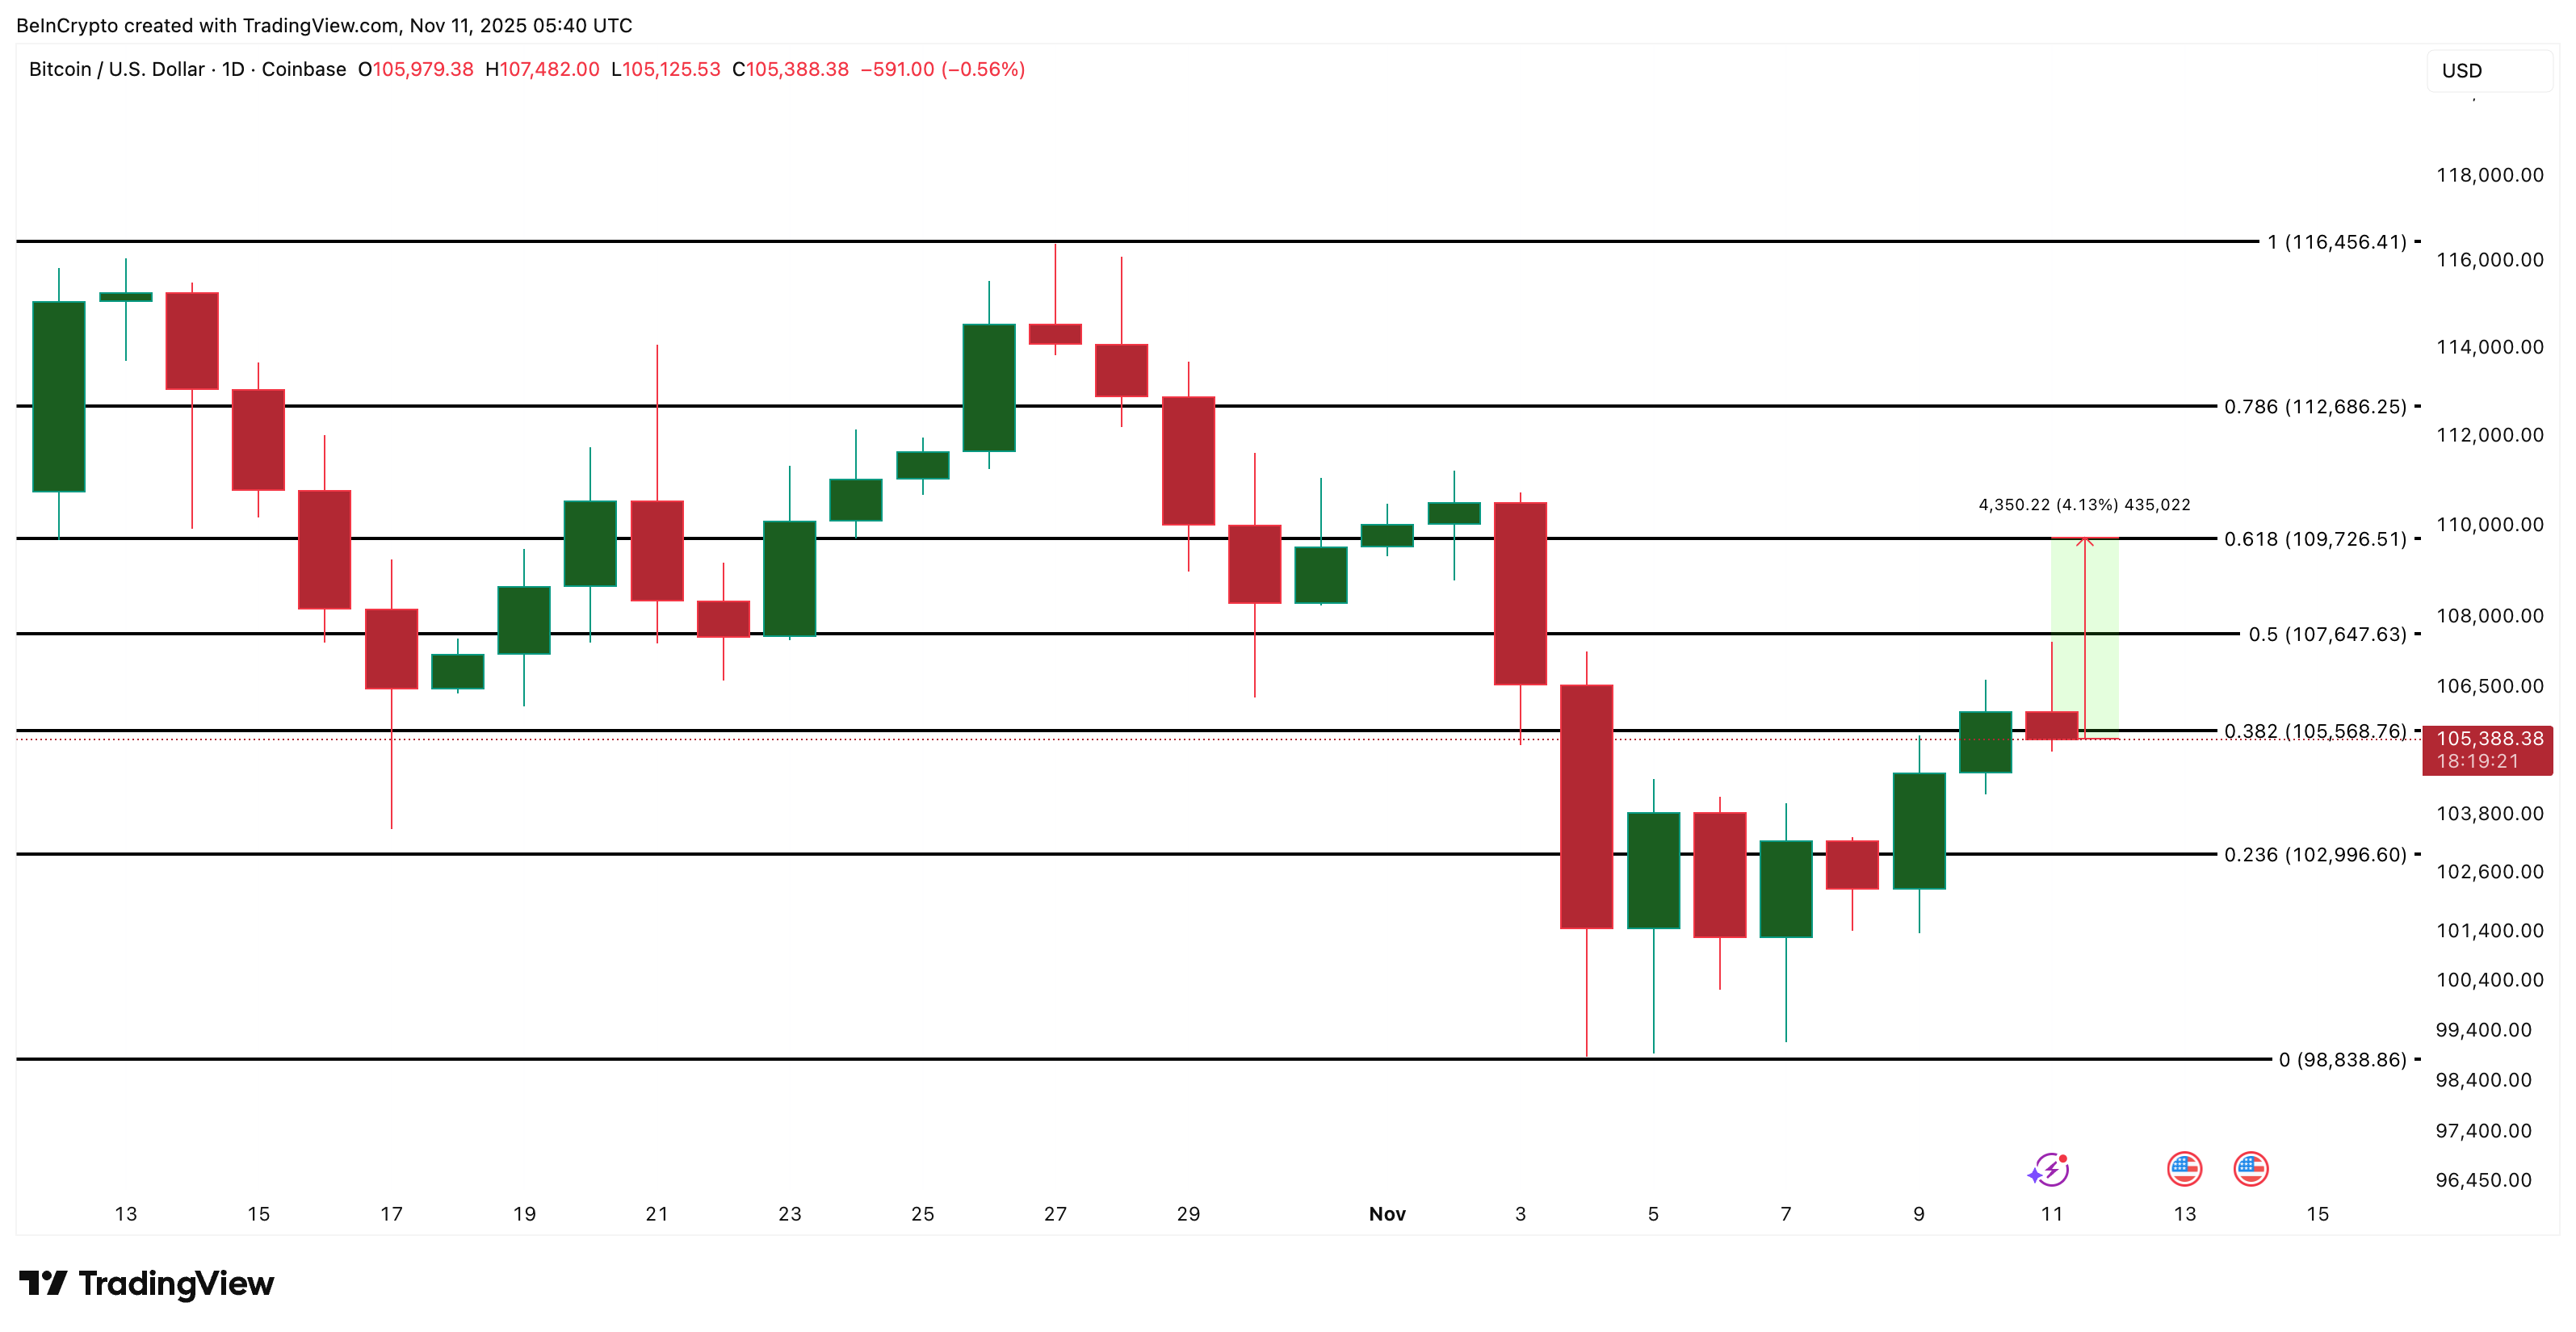
However, a daily close below $102,900 could weaken the structure and expose $98,800, invalidating the short-term bullish setup.
The post Bitcoin Price Bounce Likely Despite 1,300% Jump in Selling — Here’s Why appeared first on BeInCrypto.