
Bitcoin’s drop back into the mid-$90,000s has reignited the debate: is this the start of a true bear market, or a sharp reset inside an ongoing uptrend? Analysts are converging on the same battleground levels but differ on what they imply.
Has The Bitcoin Bear Market Arrived?
Macro swing-trader “The Great Mattsby” (@matthughes13) argues that, structurally, Bitcoin is still tracking a familiar pattern. He reminds followers that: “Back in 2024, BTC consolidated for 7 months in the $70k-$50k zone before breaking out.”
Using monthly Fibonacci retracements from the March 2024 high to the November 2022 low, he notes that Bitcoin previously tagged the 0.618 retracement at $51,518, “even wicked below, then bounced.” On a fresh set of fibs drawn from the October 2025 top to the August 2024 low, that same key level now sits at $96,975. Price is currently trading slightly below it, similar to the 2024 wick.
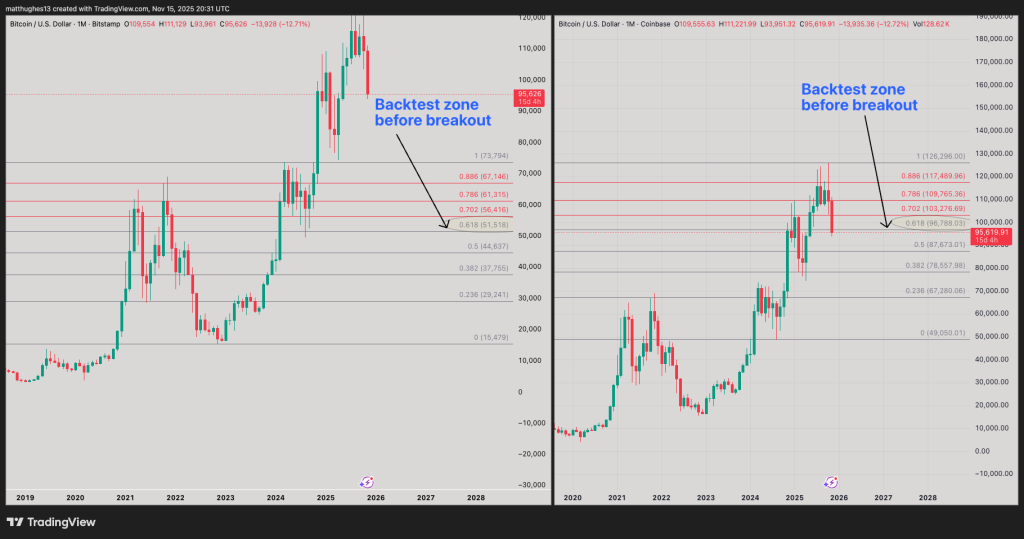
With two weeks left in November, Mattsby stresses that the close matters more than the intramonth volatility: “If BTC holds this $96-$97k zone for a monthly candle close in November, this could mirror last year’s setup: a couple more months retesting this zone, then a run to new all-time highs would be possible.”
On the weekly timeframe, however, market analyst Rekt Capital is less comfortable with the latest breakdown. For him, the 50-week exponential moving average has been a core “bullish structure” of this cycle. He writes: “Bear Markets confirm when the bullish structures that supported continued bullish momentum start to fail.”
His chart shows the current weekly candle pushing decisively below the 50-week EMA, which has previously acted as support. He sees “a high probability the Weekly Candle Closes below the 50-week EMA,” adding that the reaction in the coming weeks will be “macro trend-defining.”
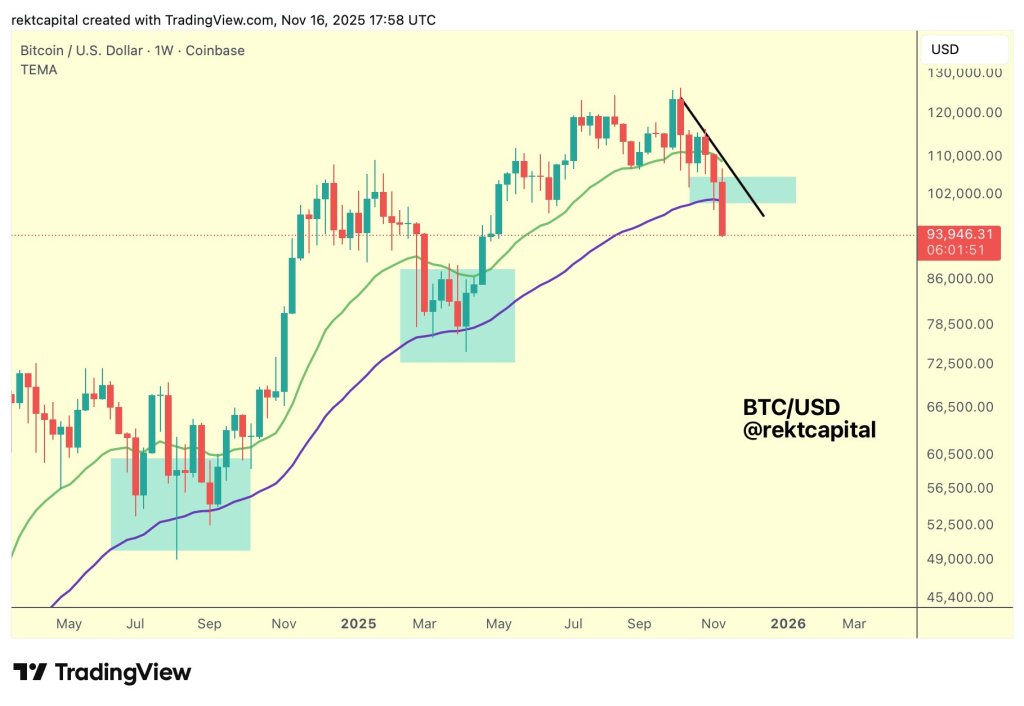
The key question, in his view: “Can BTC produce enough upside in the coming weeks to invalidate this Weekly Close below the 50 EMA and reclaim the EMA as support?”
What Bitcoin On-Chain Data Says
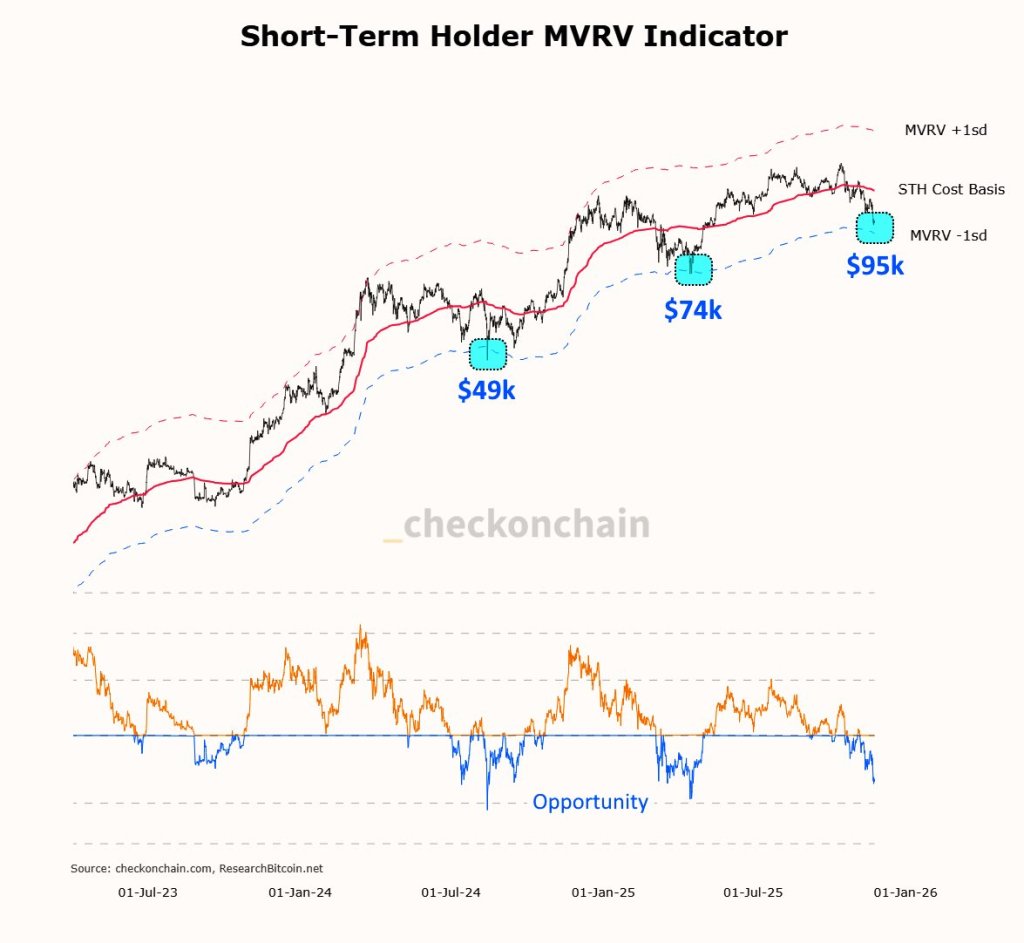
On-chain data sends a different signal. Analyst Frank (@FrankAFetter) shared Checkonchain’s Short-Term Holder MVRV chart, which tracks the profitability of recent buyers relative to their cost basis with standard-deviation bands. Bitcoin’s latest flush has driven the metric to the lower, negative-one-standard-deviation band, a zone previously tagged near $49,000 and $74,000 before meaningful bounces.
Frank’s approach is straightforward: “I’m a buyer of standard deviation moves to the downside; they don’t come often, but they tend to be excellent opportunities.”
Is The CryptoQuant CEO Right Again?
CryptoQuant founder Ki Young Ju focuses on who is selling this dip. He characterizes the move as internal rotation among long-term players rather than broad distribution: “This dip is just long-term holders rotating among themselves. Old Bitcoiners are selling to tradfi players, who will also hold for the long run.”
He recalls that his earlier top call was driven by “OG whales … dumping hard,” but argues that the landscape has shifted: “ETFs, MSTR, and other new channels kept injecting fresh liquidity. Onchain inflows are still strong. This dip is basically OG whales dragging the market.”
Looking ahead, he points to “sovereign funds, pension funds, multi-asset funds, and corporate treasuries” as building even larger, persistent liquidity channels and concludes: “The cycle theory is dead until these liquidity channels stop running.” Notably, Ki Young Ju correctly predicted in March this year that Bitcoin could see a “6–12 months of bearish or sideways price action.”
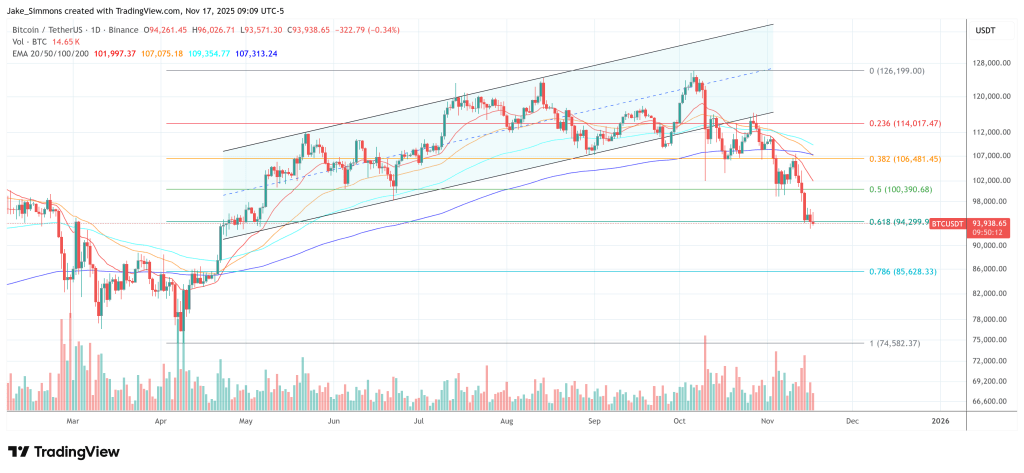
In short, the technical picture has clearly weakened, with the 50-week EMA and the $96,000–$97,000 monthly Fibonacci zone now acting as critical lines in the sand. If Bitcoin can reclaim the weekly EMA and secure a monthly close above that 0.618 retracement, the case for this being a deep but standard consolidation remains credible.
A sustained failure at these levels, by contrast, would lend significant weight to the bear-market argument. For now, the verdict hinges on how the next few weekly and monthly candles close, not on the intraday noise.
At press time, BTC traded at $93,938.
Featured image created with DALL.E, chart from TradingView.com

Editorial Process for bitcoinist is centered on delivering thoroughly researched, accurate, and unbiased content. We uphold strict sourcing standards, and each page undergoes diligent review by our team of top technology experts and seasoned editors. This process ensures the integrity, relevance, and value of our content for our readers.