
Join Our Telegram channel to stay up to date on breaking news coverage
The XRP price dropped 3.6% in the last 24 hours to trade at $2.18 as of 3.45 a.m. EST on a 66% surge in daily trading volume to $7.27 billion.
This comes as excitement builds for the launch of four new spot XRP ETFs between today and November 25, with Franklin Templeton’s EZRP the first out of the gate.
The Clarity Act: You’re gonna see hundreds of millions, probably hundreds of billions of dollars, perhaps even trillions of dollars flowing into digital assets!
7 #XRP ETFs to be launch this month! pic.twitter.com/vnI8s5b7qg
— Skipper | XRPL (@skipper_xrp) November 18, 2025
Despite the drop, investors are hoping the launches could help inspire a turnaround for the struggling Ripple token. But some analysts warn that XRP could see further downside before buyers intervene.
🚨WHY IS XRP FALLING EVEN AFTER THE SUCCESFUL LAUNCH OF THE XRP ETF?
Canary Capital’s $XRP ETF saw strong early demand, but whale selling and market weakness pushed XRP down 11%.
Despite the massive inflows, XRP’s price has declined around 11% since November 13. The markets… pic.twitter.com/mx4jVEZDKE
— Skipper | XRPL (@skipper_xrp) November 18, 2025
XRP Price: On-Chain Action Signals Change
The XRP price saw more whale activity and rising interest on-chain, even as the price sold off. Whales moved millions of XRP across wallets last week, adjusting positions ahead of the ETF launches.
Active addresses also increased, suggesting traders and investors are preparing for market shifts.
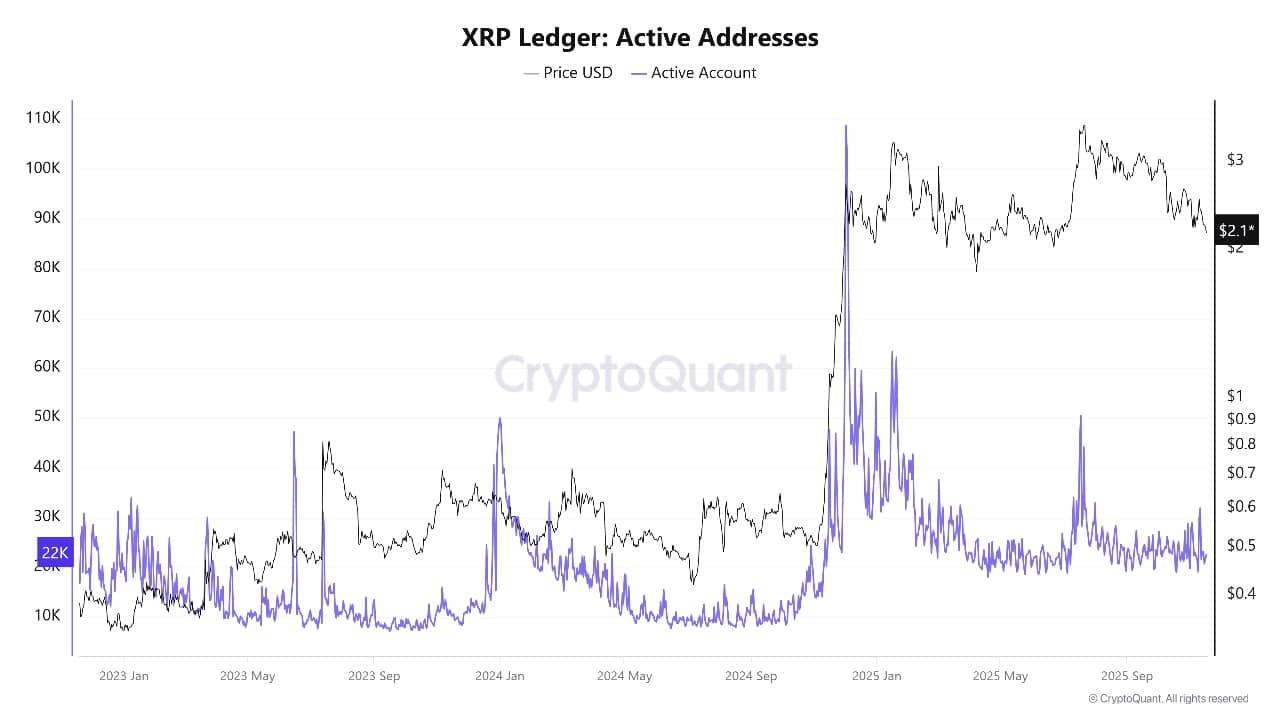
XRP Active Addresses Source: CryptoQuant
Despite the negative price trend, the ongoing selloffs have not dampened all market activity. Network volumes rose, with more than $250 million reportedly flowing into the XRPs ETFs before their official launch, showing strong institutional curiosity despite volatile conditions.
Many long-term holders are keeping their coins, while some short-term traders have taken profits. Big investors and funds are also buying more, hoping prices will rise when the new ETFs bring in fresh demand.
However, sentiment is still mixed. Some investors think prices could drop again before all four ETFs launch, just like what happened with Bitcoin and Ethereum. Others say new inflows and steady network activity show that demand could recover quickly.
XRP Price Support Zone Holds Strong
The XRP price is resting right above a critical support zone between $2.16 and $2.00, marked by a capitulation low from recent selloffs.
Key technical indicators signal caution but not panic: The RSI (Relative Strength Index) is at 41.82, showing that the coin is approaching oversold territory. If RSI drops near 30, buyers may soon return, as seen earlier this year.
The 50-week SMA (Simple Moving Average) now sits higher at $2.53, while the 200-week SMA remains supportive at $1.05. XRP is trading below the shorter SMA but well above the longer one, suggesting the medium-term trend is wobbling but the longer trend is intact.
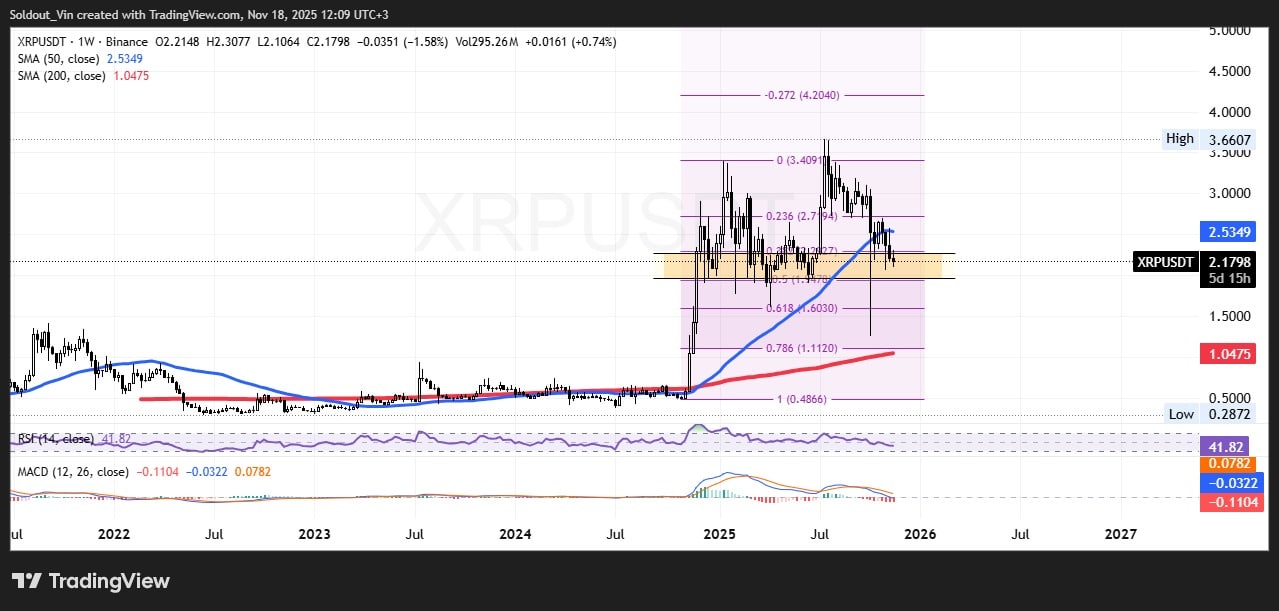
XRPUSDT Analysis Source: Tradingview
MACD (Moving Average Convergence Divergence) is negative at -0.11, with the orange signal line slightly above the blue. This points to slowing momentum, but not a deep crash.
The current price action is drifting within a range. If buyers defend the $2.16–$2.00 support, a rebound to test resistance at $2.54 is possible. A push above this resistance could open the door to $2.77 (the 0.236 Fibonacci retracement) and then $3.40, matching peaks from past rallies.
However, if sellers take control and XRP loses support at $2.16, the price could drop quickly to $2.02 or even $1.88, where the next major buying zones sit.
Such a fall would mirror previous ETF launch price patterns. Still, traders remain hopeful, looking for a reversal as new ETFs bring extra liquidity and fresh buyers.
For now, if support holds and ETF launches go well, the XRP price may finally bounce back.
Related Articles:
Best Wallet – Diversify Your Crypto Portfolio

- Easy to Use, Feature-Driven Crypto Wallet
- Get Early Access to Upcoming Token ICOs
- Multi-Chain, Multi-Wallet, Non-Custodial
- Now On App Store, Google Play
- Stake To Earn Native Token $BEST
- 250,000+ Monthly Active Users
Join Our Telegram channel to stay up to date on breaking news coverage