The cryptocurrency landscape is once again rife with speculation as Bitcoin traverses its current fourth halving cycle. Amidst varied predictions, renowned crypto analyst CryptoCon’s insights, grounded in the Gann Square methodology, the November 28 Halving Cycles theory, and the 5.3 Diminishing Returns theory have garnered significant attention.
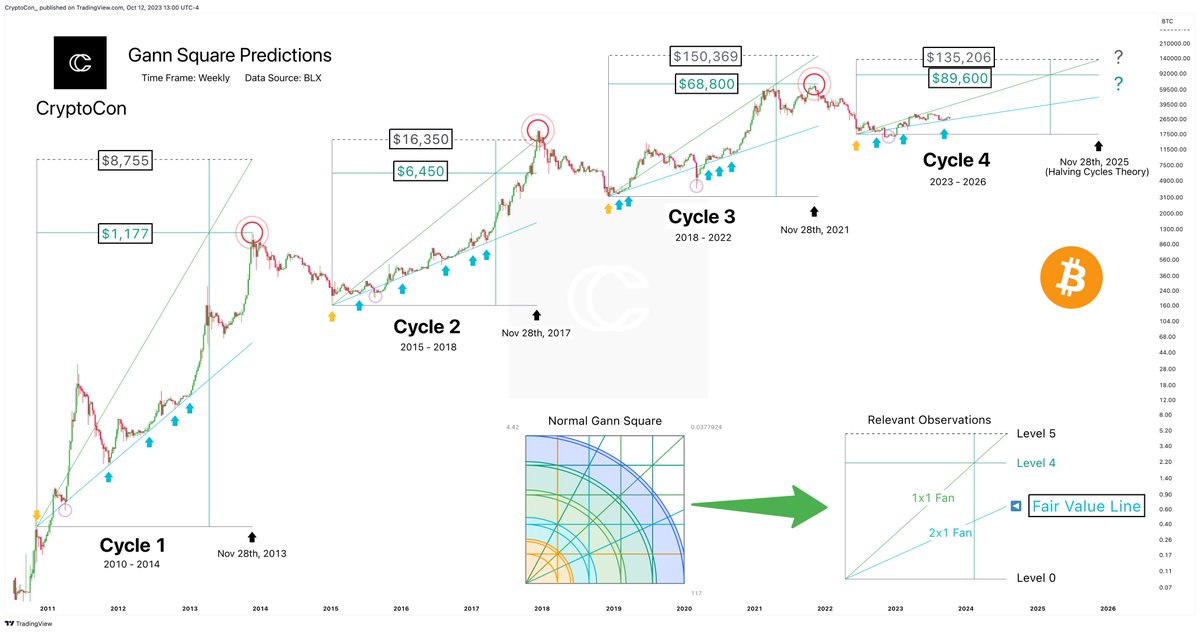
CryptoCon remarked via X (formerly Twitter) today, “The Gann Square predicts either $89,000 or $135,000 for the Bitcoin top this cycle.” He emphasized the accuracy of the Gann Square theory during previous cycles, pointing out its precision in predicting the cycle tops.
Will Bitcoin Price Reach $135,000?
According to the analyst, by leveraging the “blue 2×1 fan as the fair value line and drawing the end at Nov 28th (Halving Cycles Theory),” the Gann Square successfully pinpointed the tops of cycles 1 and 3 at the fourth level. However, the second cycle diverged, settling slightly above the fifth level.
This sets the stage for two potential outcomes in the ongoing fourth cycle, with the $135,000 prediction aligning with both CryptoCon’s November 28th price model and his Trend Pattern price model. Conversely, the $89,000 figure is aligning with the 5.3 diminishing returns theory.
Historical data further adds depth to this analysis. Bitcoin’s inaugural cycle, spanning 2010-2014, saw it catapult from a minuscule value to a peak of $1,177. The subsequent 2015-2018 cycle commenced at $250, witnessing an unprecedented climb to $20,000 by its close. The journey from 2018-2022 manifested Bitcoin’s resilience as it surged from sub-$6,000 levels to a commendable $68,800.
Delving into the intricacies of the Gann Square’s “Fan” Lines offers more clarity. The “2×1 Fan” line, represented in blue, plots a trend angle where the price progression is double that of time. Traditionally, when the Bitcoin price is close to this line, it indicates a “fair value”.
In its 13-year history, Bitcoin has only extremely rarely fallen below the line, most recently in late 2022 following the collapse of FTX, then the second largest crypto exchange, and during the Covid crash in March 2020.
The “1×1 Fan” line, depicted in green, portrays a market in equilibrium with prices increasing in tandem with time. Historically, Bitcoin’s price peaked near this line during the parabolic run-up in the second and third cycles, providing the theoretical basis for the $135,000 prediction.
The Diminishing Returns Theory: Only Sub-$90,000?
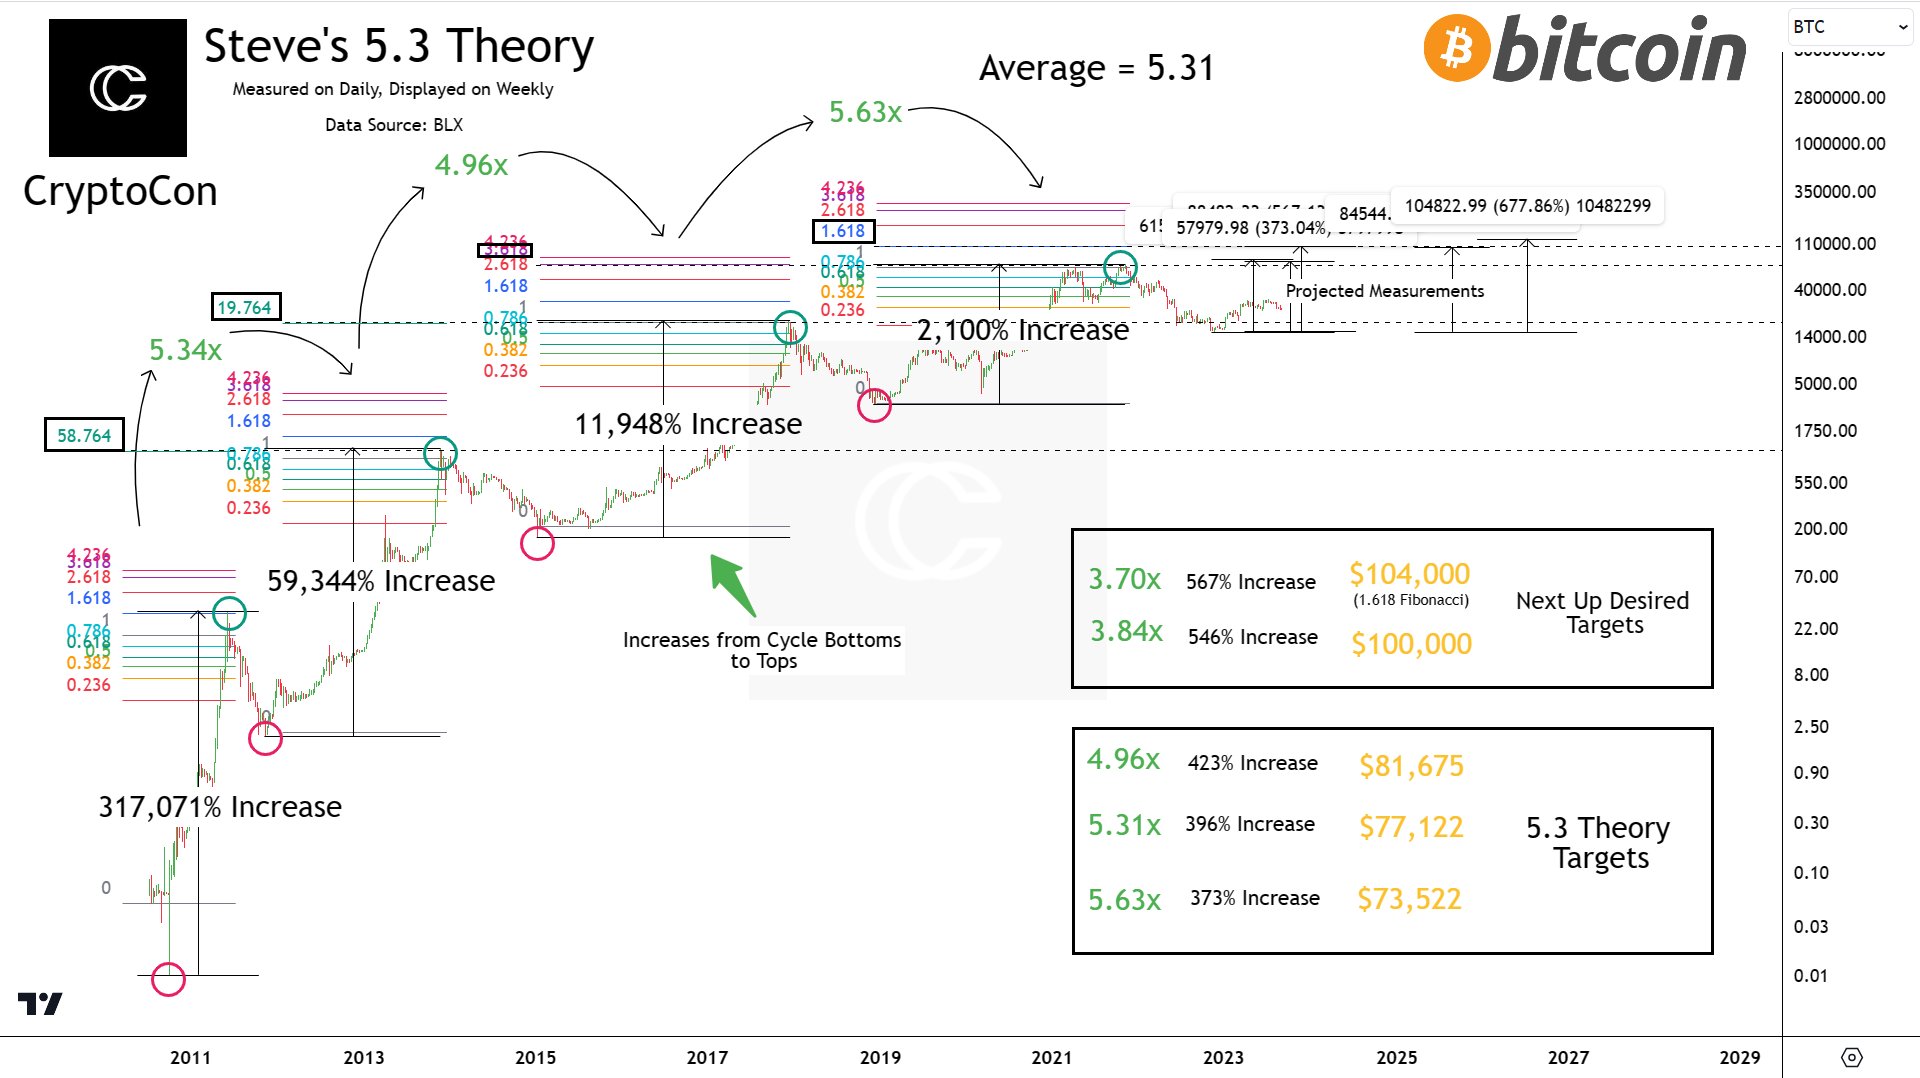
In a subsequent post, CryptoCon further explained the $89,600 target. He stated that “$90k is slightly above the 5.3 diminishing returns theory.” According to the theory, Bitcoin’s returns diminish by a factor of 5.3x from the bottom to the top of each cycle, suggesting the next cycle’s peak might be around $77,000.

CryptoCon remarked, “After measuring returns from cycle bottoms to tops on the daily time frame as precisely as possible, the returns from cycle tops to bottoms are not 5.3. They are as follows: 5.34x, 4.96x, and 5.63x.”
Diving deeper, CryptoCon pointed out, “There is merit to the 5.3, as the average of these numbers is 5.31. However, we cannot say for sure that this will be the returns if this is just an average.”
Highlighting the potential peaks based on past cycles, he commented on the more grounded numbers. “The real numbers so far range from the lowest cycle top of $73,522 to the highest at $81,675 with an average cycle top of $77,122.”
Discussing the possibilities of Bitcoin hitting a much-anticipated $100,000 mark, CryptoCon explained, “$100,000 would mean a 3.84x diminish, implying Bitcoin would need to exhibit a drastically lower diminishing return rate this cycle.”
Drawing attention to Bitcoin’s historical relationship with Fibonacci extensions, he stated, “Bitcoin has consistently hit a Fibonacci extension level at each cycle top. If $77,000 is the anticipated target, this would be a deviation. The cycles have previously matched Fibonacci extensions of 58.764, 19.764, and 3.618. For this cycle, the lowest Fibonacci extension measured from weekly candle bodies is the 1.618, suggesting a price of $104,000 which corresponds to a 3.7x diminish from the last cycle.”
CryptoCon concluded by inviting speculations on whether external factors, such as the approval of spot Bitcoin ETFs, could provide the necessary momentum to shift these models. “Many believe that ETFs will have the strength to disrupt these models and predictions. Returns are evidently diminishing, but is the 5.31x ($77,122) average return going to be this cycle’s peak?”
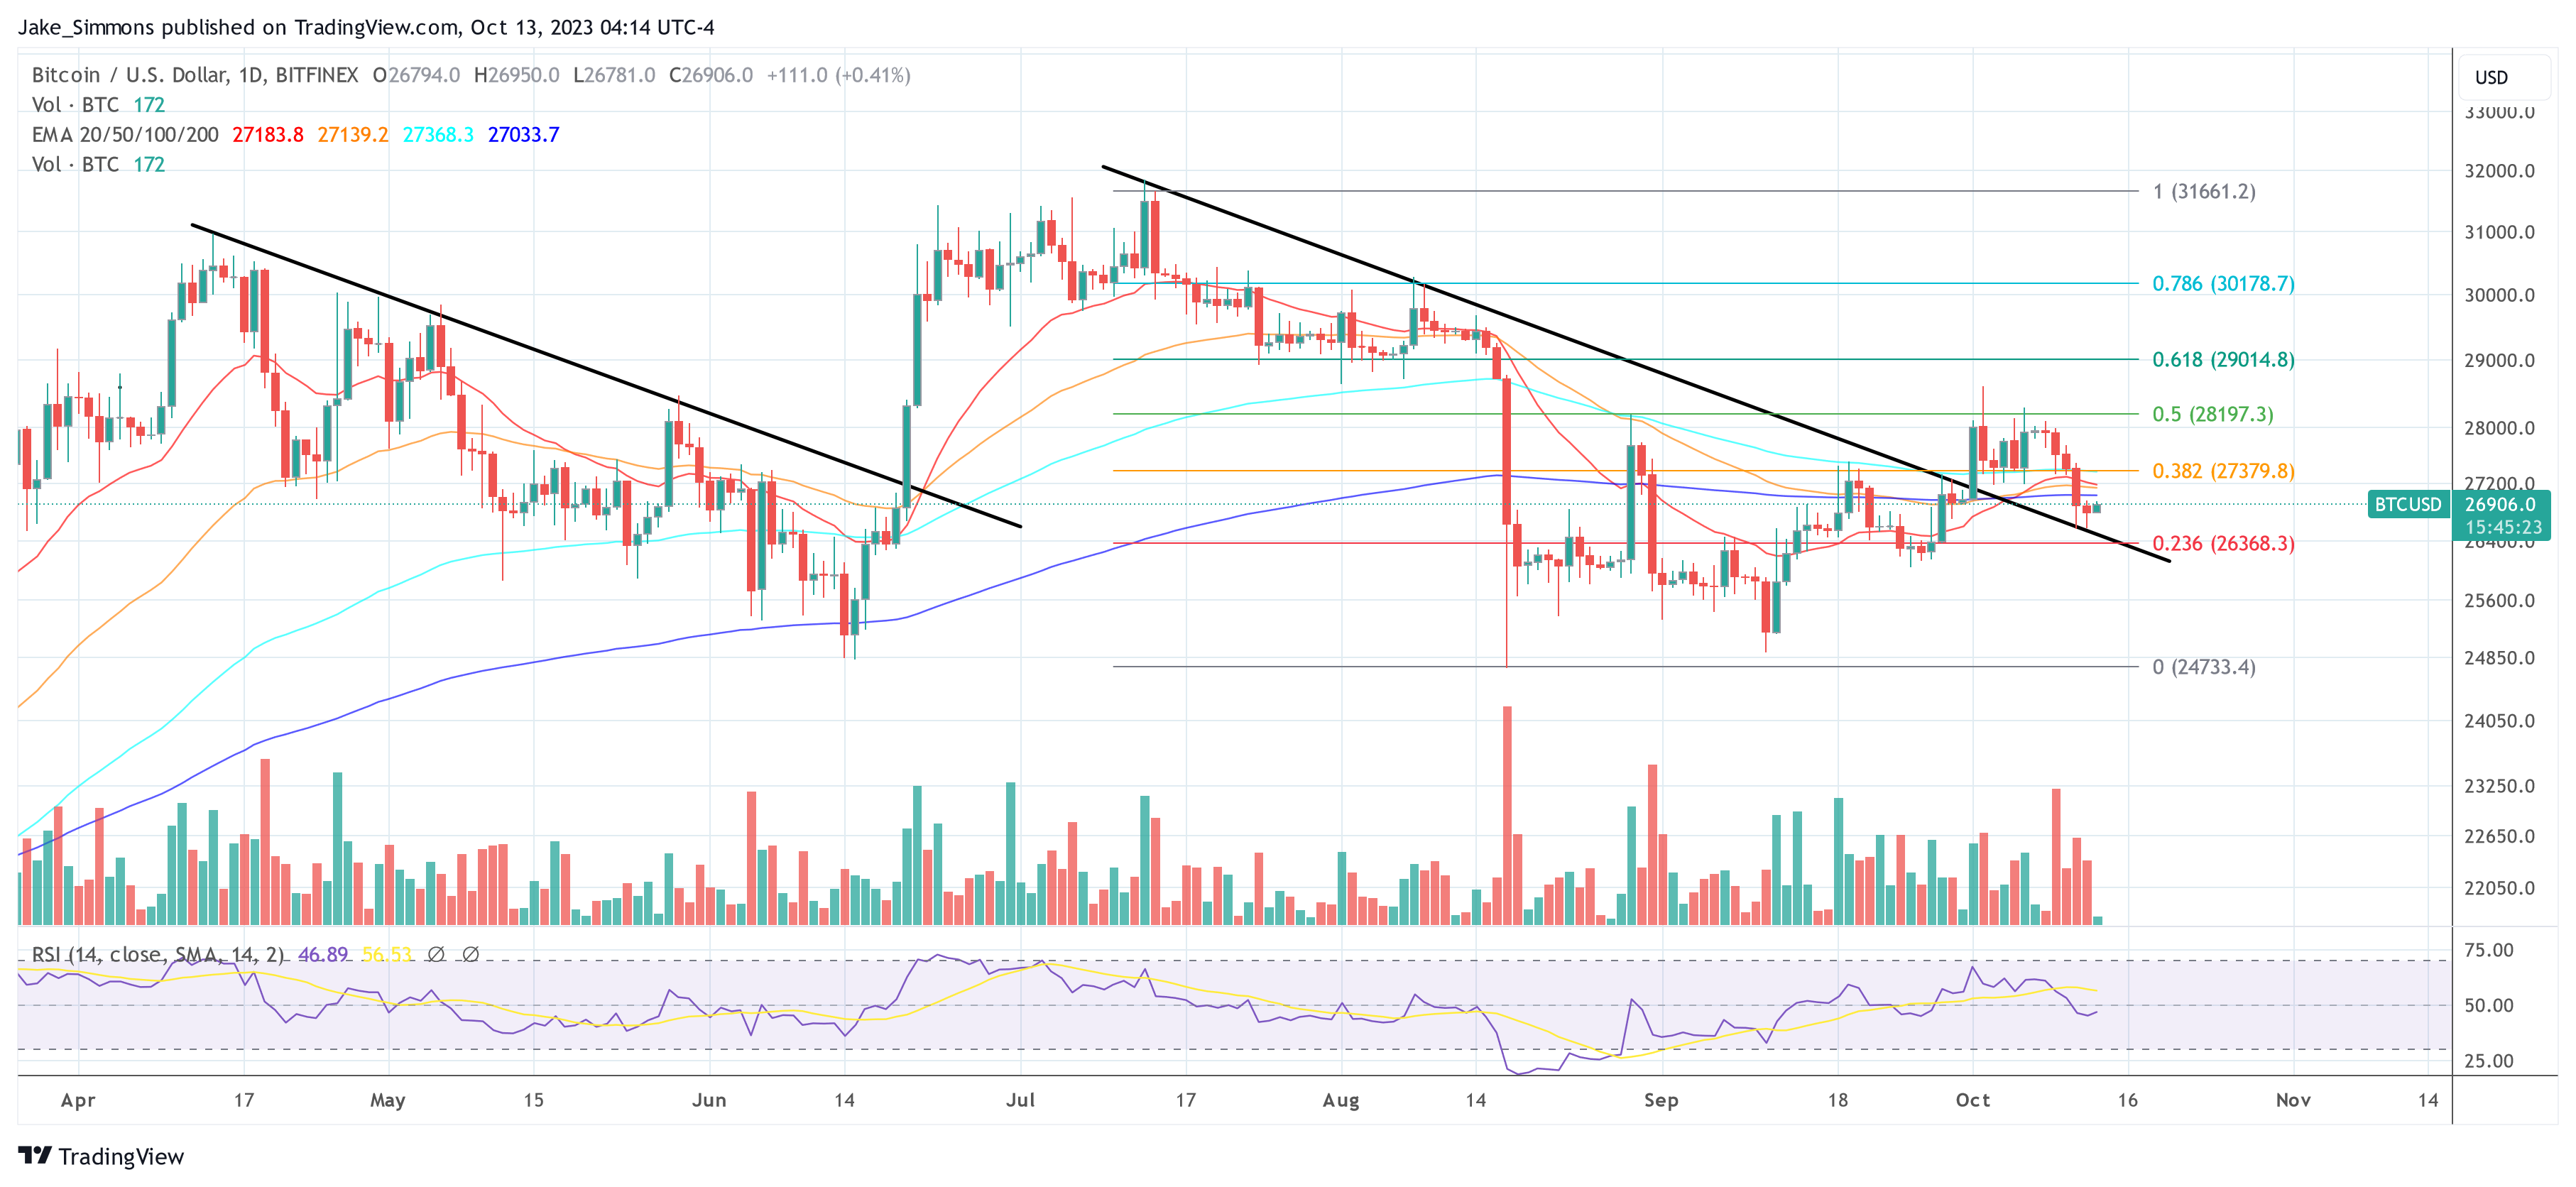
At press time, BTC traded at $26,906.

Featured image from Shutterstock, chart from TradingView.com
