The Shiba Inu (SHIB) price trend has shown a downward trajectory since August and is approaching its yearly low.
During this period, the price also fell below the $0.0000080 horizontal support level, which had held for a year.
Shiba Inu Yearly Low Risks Being Reached
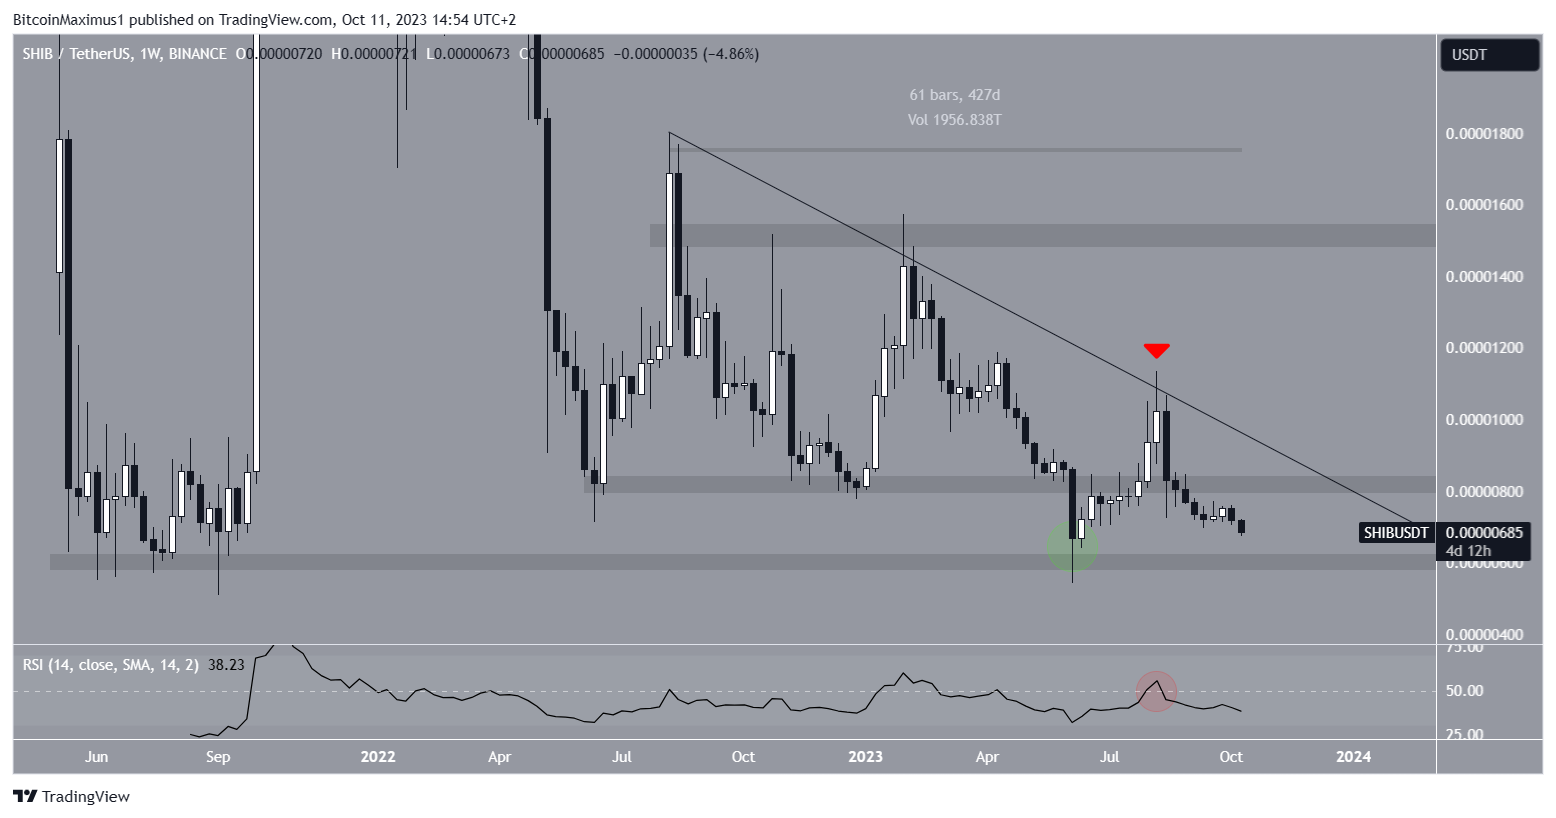
In the weekly analysis of Shiba Inu, it is evident that the price has declined since facing rejection from a long-term descending resistance trendline in August. This particular trendline has been in place for 427 days.
During this downward movement, the altcoin dropped below a significant horizontal support area at $0.0000080. It’s important to note that, except for a brief deviation in July, this area had consistently provided support for over a year.
Crypto investing, simplified. Get SHIB price predictions here.
Typically, when a breakdown occurs, it’s expected for the price to retest the same area and confirm it as a new resistance level. However, this did not happen with the Shiba Inu price; instead, it continued its descent.
The Relative Strength Index (RSI) is a key momentum indicator used by traders to assess whether a market is overbought or oversold, as well as when to buy or sell.
The weekly RSI presents a bearish reading for the meme coin. Readings above 50 in the RSI, along with an upward trend, typically indicate that bulls hold an advantage. Conversely, readings below 50 signify the opposite.
In this case, the RSI was rejected at the 50 level (red circle) in August and is currently on a downward trajectory.
Your crypto compass is here. Navigate with us.
SHIB Price Prediction: Where to Next?
The analysis of the daily timeframe does not provide a clear confirmation of the trend’s direction.
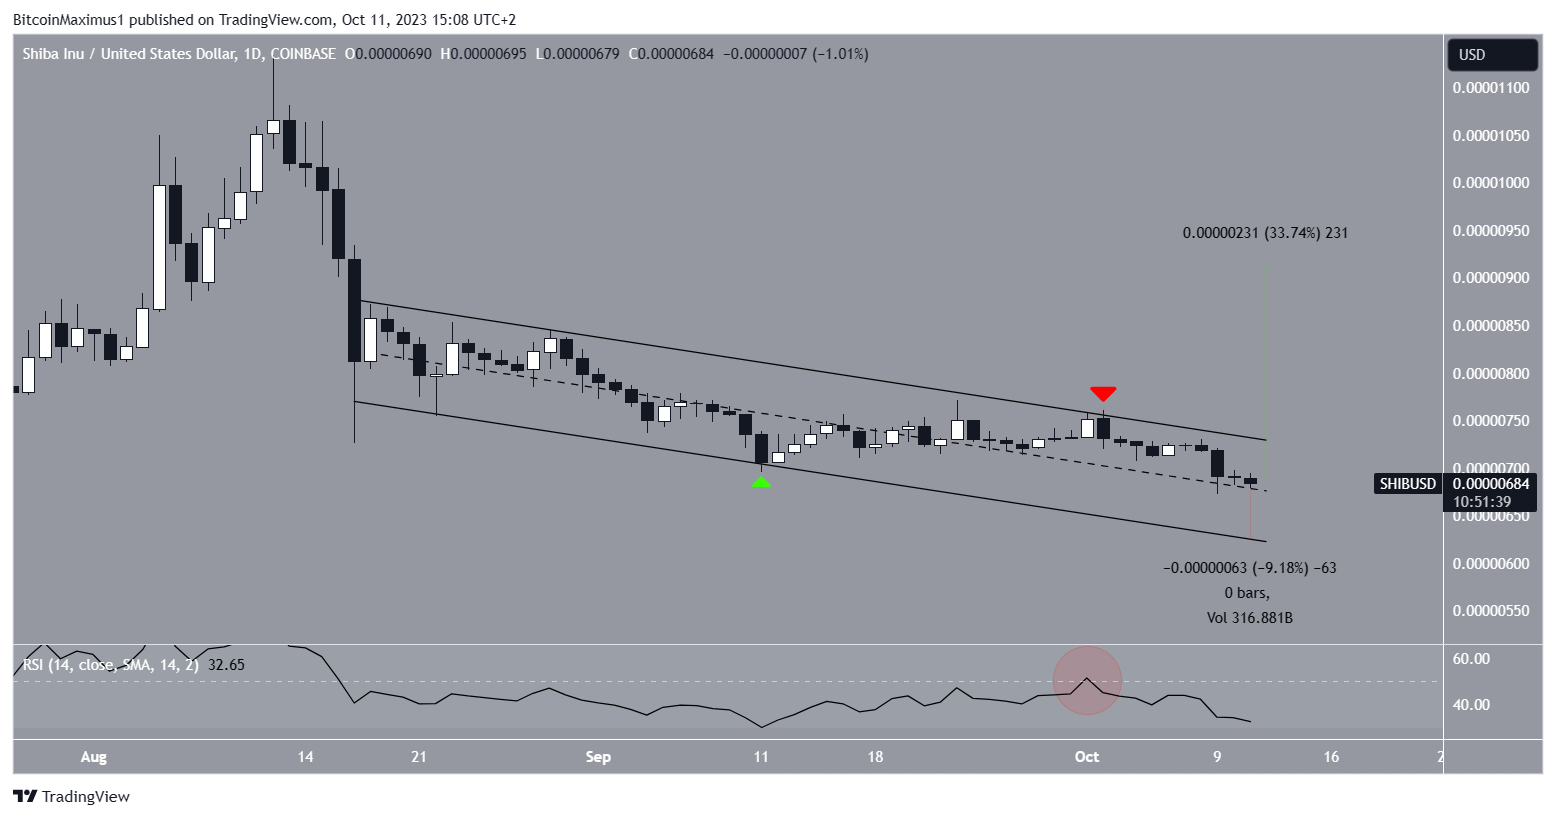
Since August 14, the Shiba Inu price has been downward within a descending parallel channel. Notably, the price recently saw a bounce at the support line of this channel on September 11 (green icon).
However, as the meme coin approached the channel’s resistance line, it faced rejection on October 2 (red icon). It has been in a declining phase since. Simultaneously, the Relative Strength Index failed to breach the 50 level (red circle) and is currently on a downward path.
Taking all these factors into consideration, the most probable future scenario for the cryptocurrency is a potential 9% decline towards the support line of the channel, which is situated at $0.0000065.

Despite this bearish Shiba Inu price prediction, a breakout from the channel will indicate that the trend is still bullish.
If that occurs, a 33% increase to the next resistance at $0.0000095 will likely be the future price movement.
Check Out the 9 Best AI Crypto Trading Bots to Maximize Your Profits
For BeInCrypto’s latest crypto market analysis, click here.
The post Shiba Inu (SHIB) Could See 33% Price Rebound as Yearly Low Looms appeared first on BeInCrypto.
