
Join Our Telegram channel to stay up to date on breaking news coverage
The Bitcoin price slid more than 3% in the past 24 hours to trade at $88,810 as of 12:09 a.m. EST on trading volume that rose 54% to $45.1 billion.
The drop comes even as the crypto market dropped 2.7% to a $3.041 trillion market capitalization, losing over $100 billion.
As a result of the dramatic drop, long traders were massively liquidated, with total liquidations totalling $207 million, according to Coinglass data.
This selloff stems from a general “flight from risk” among investors in response to the accelerating launch of spot BTC exchange-traded funds (ETFs).
Data from Coinglass shows that spot BTC ETFs have recorded consecutive 7 days of net outflows, losing $19 million on Monday alone.
Meanwhile, Michael Saylor’s Strategy is still betting on a BTC rally, after the company purchased an additional 1,229 BTC for $108.8 million. After the recent purchase, the firm now owns 672,497 Bitcoin, acquired for $50.44 billion at an average price of $74,997 per BTC.
Strategy has acquired 1,229 BTC for ~$108.8 million at ~$88,568 per bitcoin and has achieved BTC Yield of 23.2% YTD 2025. As of 12/28/2025, we hodl 672,497 $BTC acquired for ~$50.44 billion at ~$74,997 per bitcoin. $MSTR $STRC $STRK $STRF $STRD $STRE https://t.co/5VvOgBYwhk
— Michael Saylor (@saylor) December 29, 2025
Bitcoin Price Gearing Up Towards A Breakout
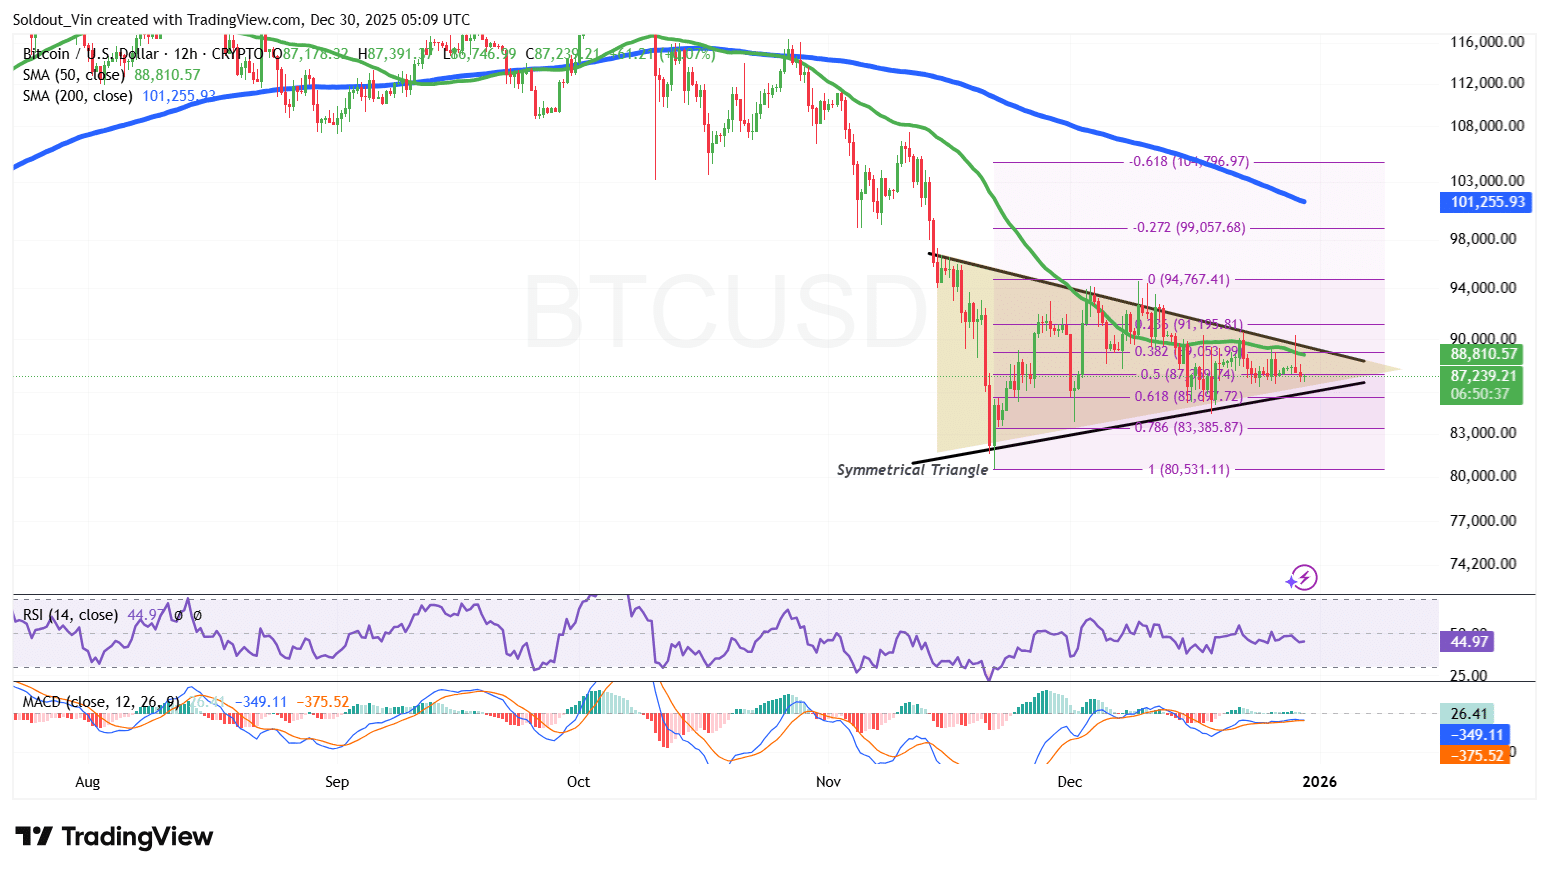
After what appeared to be sustained consolidation above $100,000 from August to late October, the BTC price lost momentum, taking a dramatic hit that sent it to levels near the $81,000 support.
The support allowed the bulls to establish this level as a demand area, with Bitcoin trading consistently above it and consolidating within a symmetrical triangle pattern.
According to the chart, BTC attempted a relief rally in the last 12-hour candle, but the current one has dropped to trade below the 50-day Simple Moving Average (SMA), making the $88,810 zone a hurdle for any bullish attempts.
Bitcoin now trades below both the 50-day and 200-day SMAs, placing it under consistent bearish pressure but within a symmetrical triangle pattern.
Based on the analysis, Bitcoin is still consolidating between the 0 Fib level around $94,000 and the 0.618 Fib area at $85,600, forming a major sideways pattern zone before any breakout attempt.
Meanwhile, the Relative Strength Index (RSI) also supports the consolidation narrative, as it trades within the 40-50 zone, in a tug-of-war between bulls and bears.
As bears and bulls fight for dominance, the Moving Average Convergence Divergence (MACD) is showing signs of some positive momentum, with the blue MACD line crossing above the orange signal line.
Indicators suggest investors are cautious, as BTC bulls hold the demand zone.
BTC Price Prediction
According to the BTC/USD chart analysis on the 12-hour timeframe, the BTC price is gearing up for a breakout above the symmetrical triangle.
If the bulls sustain pressure above the 0.5 Fibonacci retracement level at around $87,000, BTC could rally to the upper boundary of the triangle, with the bulls targeting the upper resistance at around $94,000.
In the long term, bulls could target the 200-day SMA at $101,255.
Michaël van de Poppe, a popular analyst on X with over 816K followers, supports the bullish narrative, as Bitcoin has formed a massive bullish divergence on the daily timeframe for BTCUSD vs. Gold.
Massive bullish divergence on the daily timeframe for BTCUSD vs. Gold.
Gold comes down, #Bitcoin consolidates and this starts to look better.
On top of that, given that this is a valid bullish divergence, it implies that Bitcoin is likely to outperform Gold in the coming… pic.twitter.com/cX2Vgn9NO1
— Michaël van de Poppe (@CryptoMichNL) December 29, 2025
On the downside, if the bearish momentum picks up and the bears win the dominance battle, Bitcoin could drop under the 0.618 Fib zone, with $80,000 acting as a cushion against any downward pressure.
Related News:
Best Wallet – Diversify Your Crypto Portfolio

- Easy to Use, Feature-Driven Crypto Wallet
- Get Early Access to Upcoming Token ICOs
- Multi-Chain, Multi-Wallet, Non-Custodial
- Now On App Store, Google Play
- Stake To Earn Native Token $BEST
- 250,000+ Monthly Active Users
Join Our Telegram channel to stay up to date on breaking news coverage