
Introduction
In the early years of cryptocurrency, price movements were largely driven by isolated factors: retail adoption, exchange hacks, and technological upgrades. However, as the asset class has matured and integrated into the broader financial system, its correlation with traditional macro-economic drivers has tightened significantly. Today, Bitcoin operates less like an isolated digital experiment and more like a high-beta barometer for global liquidity conditions.
To truly understand the cyclical nature of crypto-asset valuations, one must look beyond the blockchain and analyse the underlying machinery of the fiat monetary system. Central to this analysis is the U.S. Dollar Index (DXY). This article explores the inverse relationship between the strength of the dollar and the performance of Bitcoin, positing that the DXY is not just a forex metric, but the primary signal for the liquidity tides that lift or sink the crypto market.
The U.S. Dollar Index (DXY) as a Metric of Global Tightness
The U.S. Dollar Index (DXY) is technically a measure of the value of the U.S. dollar relative to a basket of foreign currencies, heavily weighted toward the Euro (57.6%), followed by the Japanese Yen, British Pound, Canadian Dollar, Swedish Krona, and Swiss Franc. However, in the context of sophisticated crypto-asset analysis, viewing the DXY merely as a foreign exchange metric is insufficient. It serves a far broader and more critical function: it is the primary proxy for global financial tightness and the scarcity of collateral in the offshore banking system.
When the DXY strengthens, rising above key technical levels such as 100 or 105, it typically signals a contraction in the availability of dollars outside the United States, a phenomenon often referred to as a dollar shortage in the Eurodollar market. A stronger dollar is negative for global liquidity conditions because it reduces cross-border credit growth and collateral. Because the vast majority of global debt, trade invoicing, and foreign exchange reserves are denominated in USD, a rising DXY increases the real debt burden on emerging markets, multinational corporations, and sovereigns. This forces a liquidation of risk assets to service dollar-denominated liabilities, creating a risk-off environment where liquidity retreats from the periphery (Bitcoin, Emerging Markets Equities) to the core (U.S. Treasuries, Cash).
Conversely, a weakening DXY implies an abundance of dollar liquidity. When the dollar falls, financial conditions ease, credit becomes cheaper to access, and the “denominator” of global asset prices shrinks. This mechanical devaluation of the measuring stick causes the nominal value of scarce assets to rise. This is the fundamental driver of the Inverse DXY thesis: that Bitcoin rallies are, in large part, a repricing event driven by the abundance of the fiat currency against which it is traded.
Bitcoin as the Ultimate Liquidity Sponge
In this framework, Bitcoin is increasingly viewed by macro-analysts not merely as a payment technology or a new form of currency, but as a direct leveraged play on the debasement of fiat currency. Due to its fixed supply schedule and its complete lack of counterparty risk or cash flows, Bitcoin reacts more violently to changes in global money liquidity (GLI) than traditional equities or even gold.
Raoul Pal, founder of Global Macro Investor, characterizes Bitcoin as the “call option on the future” and a mechanism that is coded to rise with global liquidity. The theoretical underpinning here is that equities, such as the Nasdaq 100, grow due to a combination of earnings growth (GDP) plus monetary debasement. Bitcoin, lacking earnings, grows due to network adoption (Metcalfe’s Law) multiplied by monetary debasement. Consequently, Bitcoin exhibits a higher beta (volatility) relative to the dollar’s movements. When the liquidity channel opens, Bitcoin absorbs this excess capital faster and more aggressively than assets constrained by earnings multiples or physical supply chains.
Quantitative Analysis of the Inverse DXY Relationship
The anecdotal theory of a lag is robustly supported by statistical data sourced from market analysts and quantitative researchers. However, the correlation is not static; it acts as a dynamic variable that strengthens during periods of extreme monetary intervention and can decouple during periods of isolated crypto-market stress (e.g., exchange collapses or regulatory bans). To visualize this dynamic accurately, we must first establish a mathematical framework that filters out daily noise to reveal the underlying structural current.
The Mathematics Behind the Chart
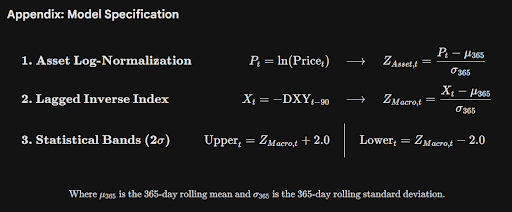
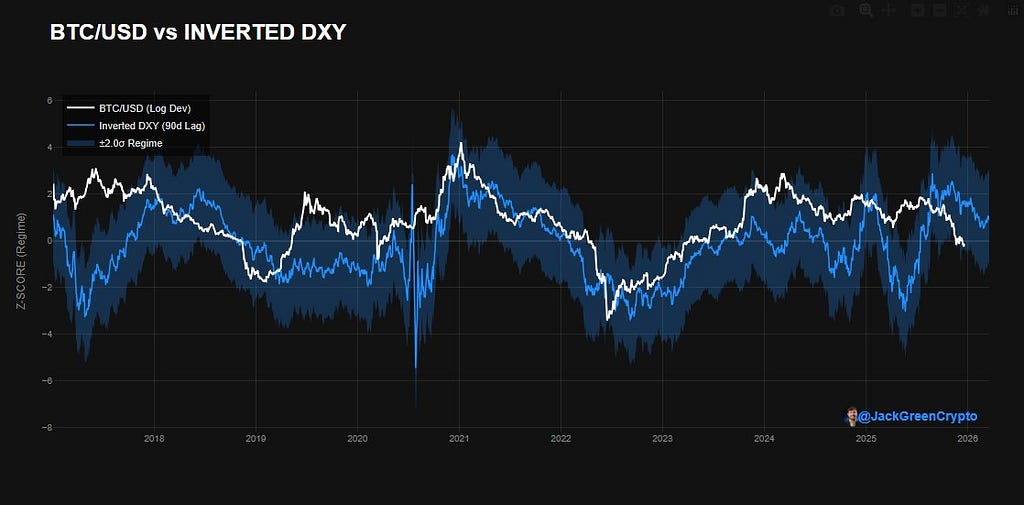
This chart acts as a Macro Regime Filter, visualizing the pressure global liquidity exerts on Bitcoin. To ensure statistical validity and comparability between the two assets, the model applies three specific transformations:
- Normalization: Bitcoin’s price undergoes a logarithmic Z-Score transformation to address scale variance and volatility differences. First, a logarithmic transformation is applied to linearize the asset’s exponential growth, ensuring that percentage changes are weighted equally across distinct market cycles rather than being skewed by absolute price levels. Second, the data is standardized against a 365-day rolling window. This normalizes Bitcoin’s high inherent volatility relative to the Dollar, converting raw price action into units of statistical deviation. This allows for a direct, magnitude-agnostic comparison of momentum relative to the asset’s own yearly trend.
- Forecasting (The Independent Variable): The US Dollar Index (DXY) is inverted and shifted forward by 90 days. This lag introduces a predictive forecast window, projecting how past contractions or expansions in global liquidity are likely to impact risk asset valuations in the present.
- Regime Definition (The Clouds): A 2-standard deviation band is applied to the Driver. This defines a statistical confidence interval. When Bitcoin trades within these bands, its price action is consistent with the prevailing macro environment. Deviations outside these bands signal statistically significant decoupling events, where isolated crypto-native drivers override global macro currents.
Historical Correlation Data: The Jamie Coutts Model
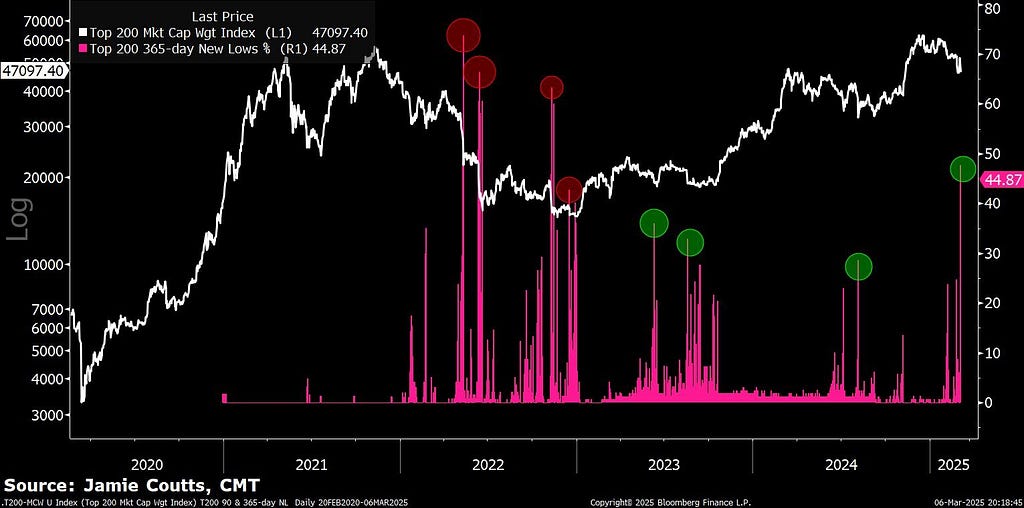
With the mathematical framework established, we can examine the historical performance. Analysis of market data provided by Jamie Coutts (@Jamie1Coutts) of Real Vision and Bloomberg Intelligence (March 2025) highlights the predictive power of DXY movements on Bitcoin’s price. Coutts’ research focuses on the magnitude of DXY declines and their subsequent impact on BTC returns over a 90-day window. This impulse based analysis filters out daily noise to focus on structural shifts.
Table: Bitcoin Performance Following Significant DXY Declines
Source Data:
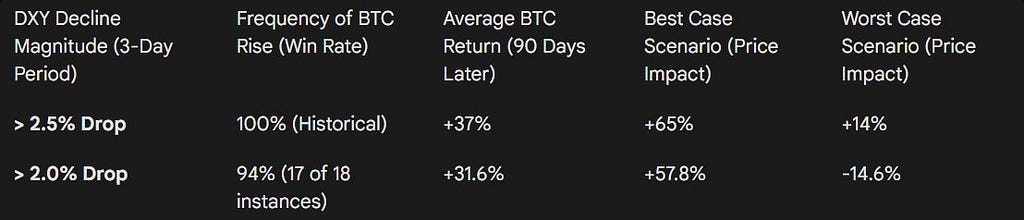
The data indicates a remarkably high degree of statistical significance. A rapid depreciation of the dollar (>2.5% in 3 days) has historically served as a perfect “buy signal” for Bitcoin, but the returns are realized over the subsequent three months, confirming the lag thesis. The “win rate” of 94–100% for significant DXY drops indicates that the inverse relationship is one of the most reliable signals in the crypto-asset market.
Volatility-Adjusted Correlation

An important nuance in the quantitative analysis is the changing volatility profile of Bitcoin. Fidelity Digital Assets reported that by late 2023 and into 2025, Bitcoin’s volatility had declined below that of many S&P 500 constituents.
As Bitcoin’s volatility compresses, its sensitivity to DXY movements may change. A lower-volatility asset requires larger liquidity injections to move the needle, or conversely, it may track the inverse DXY more closely (linear correlation) rather than acting as a leveraged bet (exponential correlation).
Conclusion
As the digital asset class matures, the digital gold narrative is evolving into a more nuanced reality: Bitcoin is a hyper-sensitive gauge of global dollar liquidity. The inverse relationship with the DXY provides a robust, though dynamic, framework for understanding price cycles. While onchain metrics and technological updates remain relevant, one of Bitcoin’s main price drivers in the medium term will likely be the scarcity or abundance of the US Dollar.
Want More? Follow the Author on X
![]()
Bitcoin’s Hidden Driver: The Inverse DXY Relationship was originally published in The Capital on Medium, where people are continuing the conversation by highlighting and responding to this story.