
XRP (XRP) rallied 9% over the weekend to $1.50 as several technical and onchain indicators suggested it was due for a “full-scale” upward breakout.
Key takeaways:
- XRP’s funding rates and Bollinger Bands indicator warn of volatility in the coming days.
- XRP’s symmetrical triangle breakout targets $2.05.
XRP bullish reversal signals emerge
Data from TradingView showed XRP/USD remained 60% below its multiyear high of $3.66 reached in July 2025 and traded 21% below its yearly open of $1.83.
Despite this drawdown, several price indicators hinted at a potential upward breakout ahead.
Analyzing XRP’s funding rates on Binance, analyst Darkfost flagged a key bullish signal, setting XRP/USD up for an upward run.
Related: XRP price copies 2025 chart fractal that last time sparked 66% gains
The funding rates 30-day sum on Binance have “maintained a bearish bias for nearly three months, even as XRP has posted a 27% gain over the same period,” the analyst said in a recent post on X, adding:
“When such a strong consensus forms, especially after a correction exceeding 60%, it is often a sign that a potential reversal may be developing.”
XRP/USD funding rates. Source: CryptoQuant
Previous instances show that XRP tends to rise sharply when funding rates recover after prolonged periods of being negative.
This notably happened in April 2025, when XRP reached $1.25, before a “bullish recovery eventually triggered a rally that led to a 126% advance,” the analyst added.
Meanwhile, the Bollinger Bands indicator, used by traders to assess price momentum and volatility within a certain range, reached its tightest point in 10 months, signaling that a significant price move could be underway.
The two-day XRP Bollinger Bands have slipped to their tightest level since July 2025, as shown in the chart below.
The XRP/USD pair surged about 90% in July 2025 to its multi-year high at $3.66, after breaking above the upper boundary of the Bollinger Bands. The gains were 72% in July 2024.
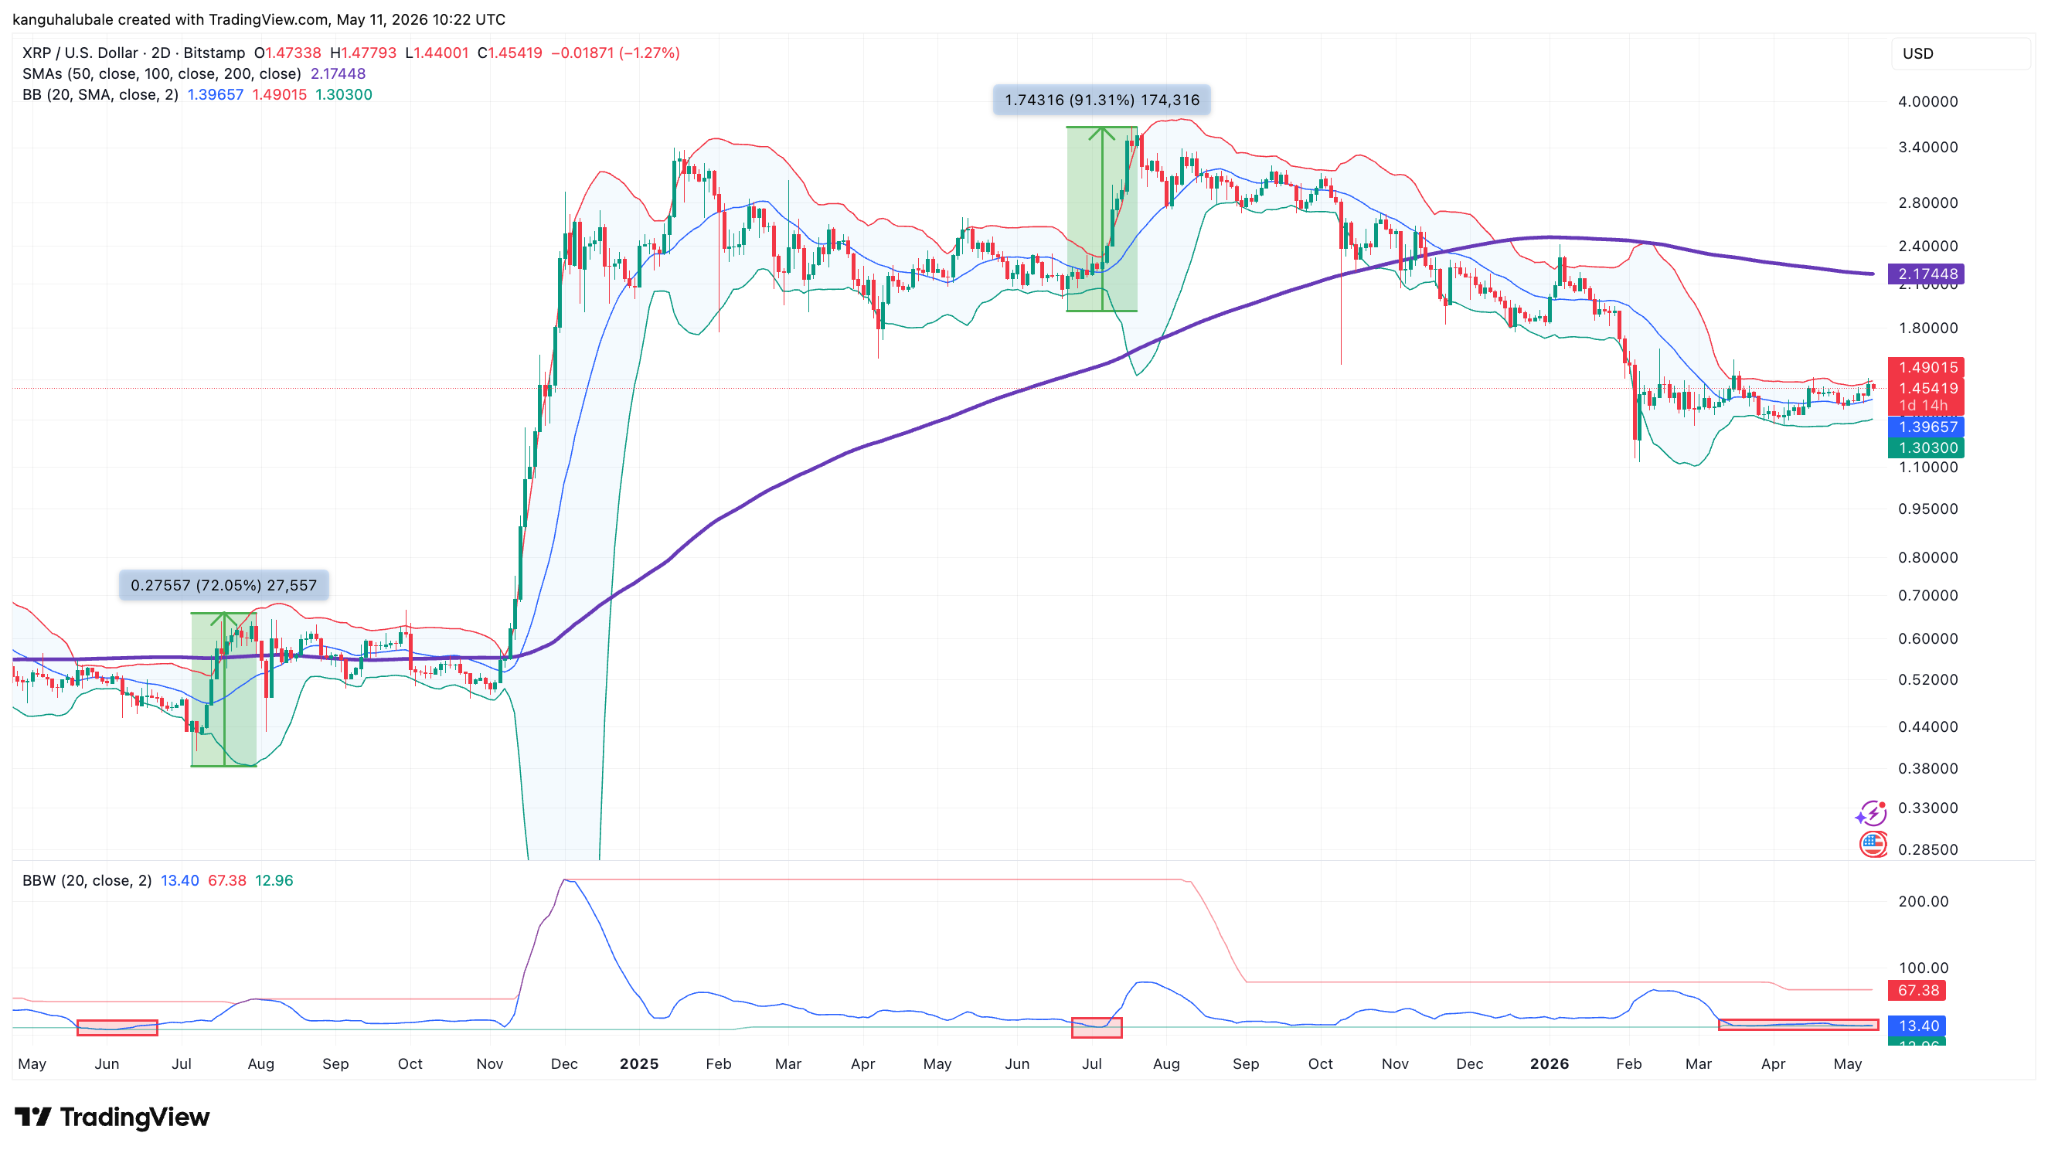
XRP/USD two-day chart. Source: Cointelegraph/TradingView
Analyst Seth said XRP has printed the “tightest Bollinger Band squeeze in years” on the daily time frame, adding:
“History says this kind of setup resolves with force.”
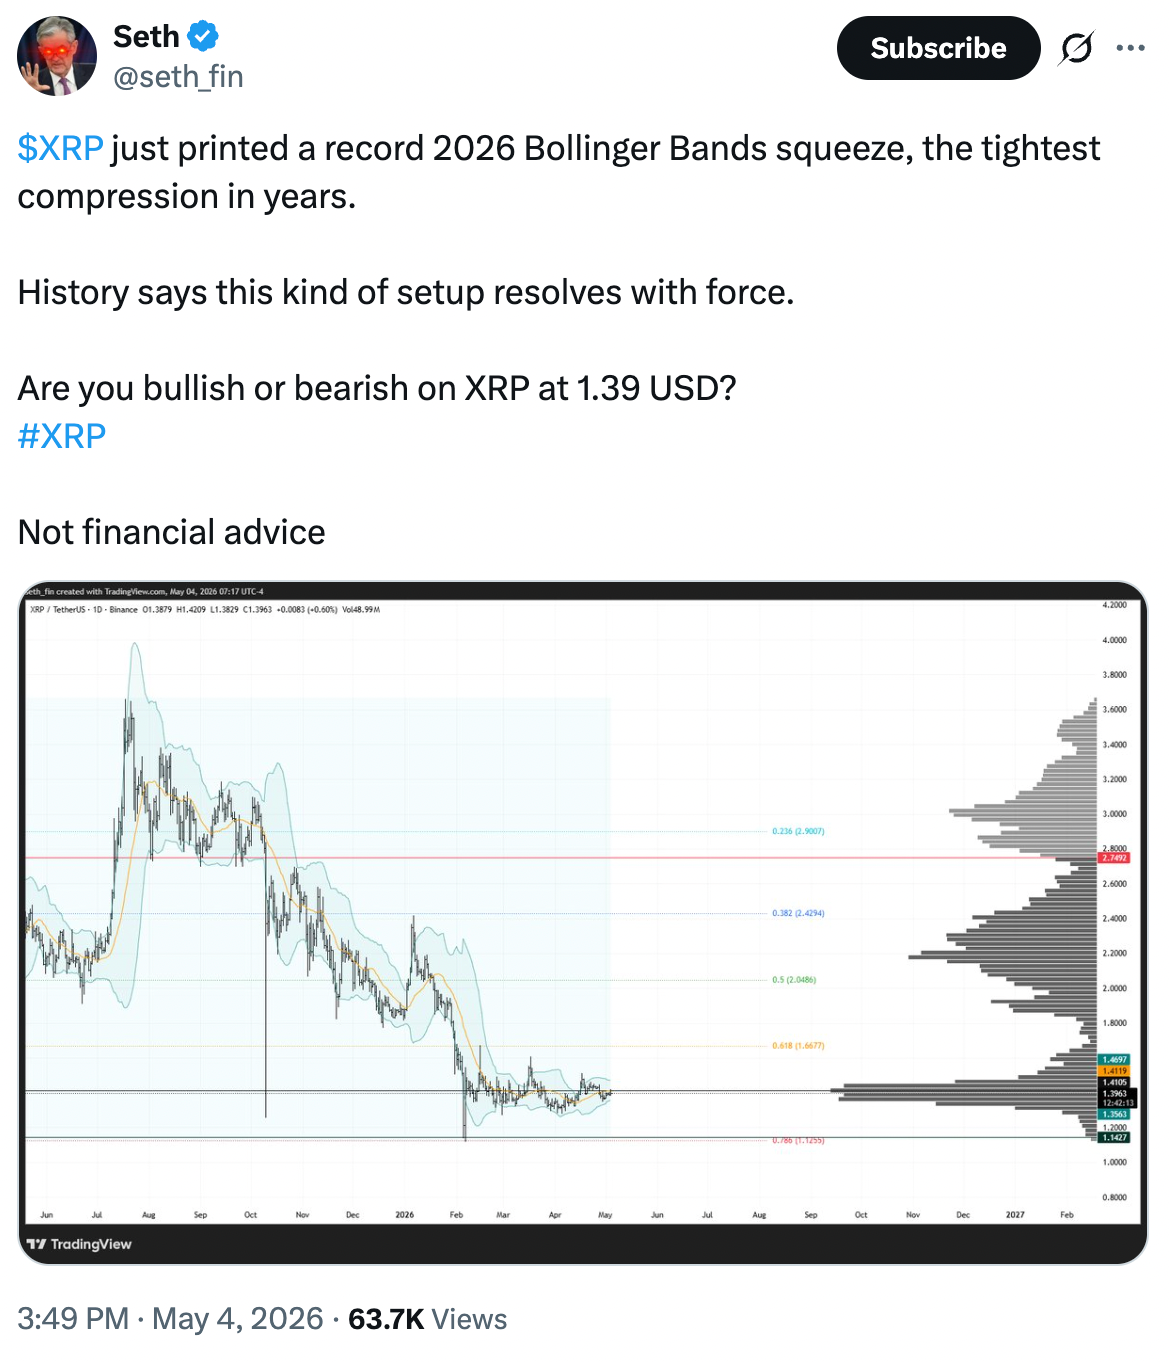
XRP/USD daily with tightening Bollinger Bands. Source: X/Seth
As Cointelegraph reported, multiple technical indicators suggested that XRP/USD is bottoming out, pointing to a possible rally to as high as $12.
XRP symmetrical triangle breakout is underway
The XRP/USD pair has broken above a symmetrical triangle on the daily chart, a setup typically associated with bullish reversals after prolonged consolidation.
The price has been compressing between two converging trend lines since February, with the upper boundary now acting as key support near the $1.40 psychological level.
A daily candlestick close above this level could open the way for a run toward the bullish target of the prevailing chart pattern at $2.05, roughly 41% above the current price.
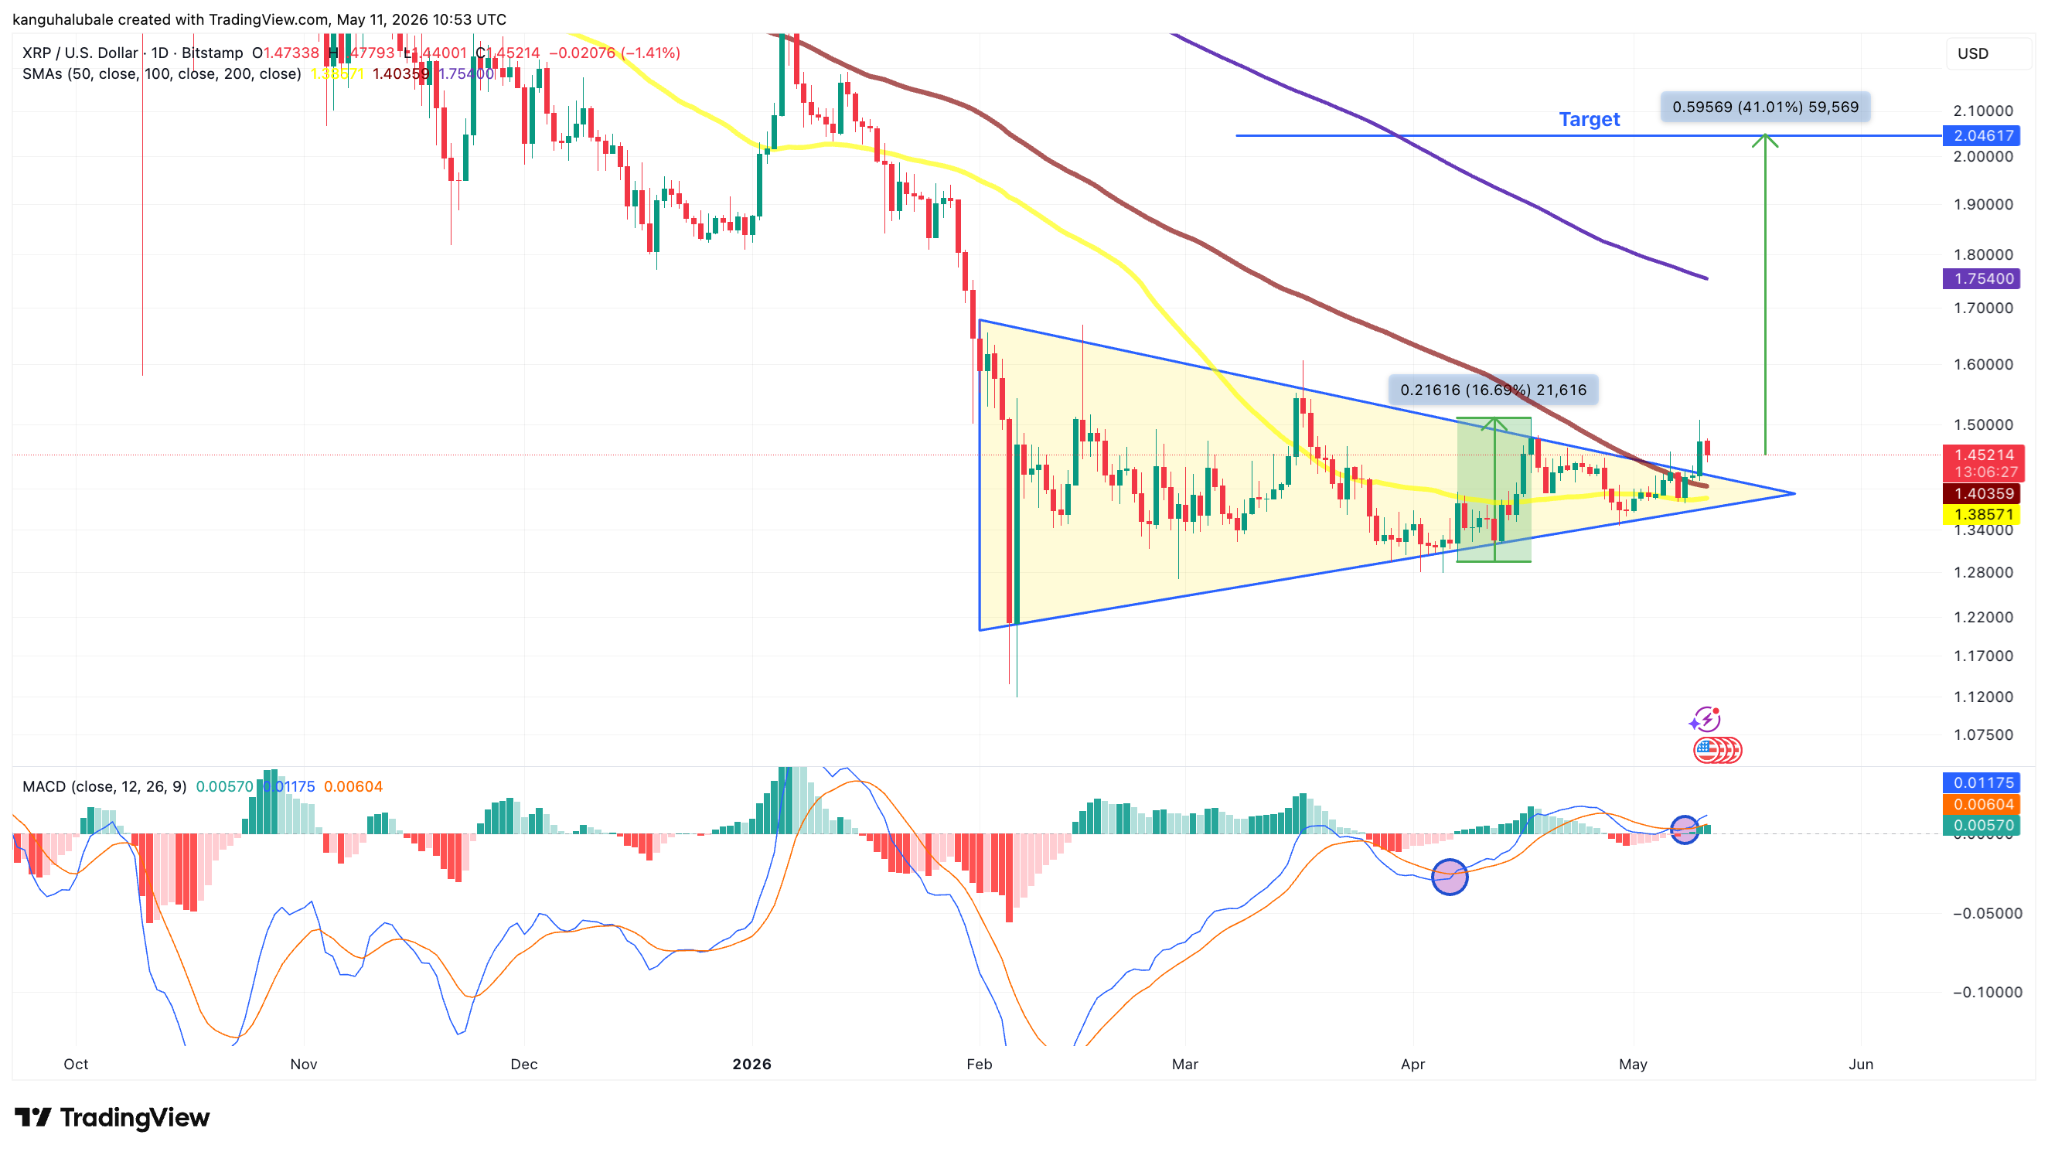
XRP/USD daily chart. Source: Cointelegraph/TradingView
Meanwhile, the moving average convergence divergence (MACD) indicator is trading above the zero line and has produced a bullish cross, indicating rising buying momentum. Historically, similar MACD crossovers have preceded strong rebounds in XRP.
Analyst CW8900 said a “full-scale rise for $XRP is imminent,” after the price bounced off a multi-year support line on the three-day chart.
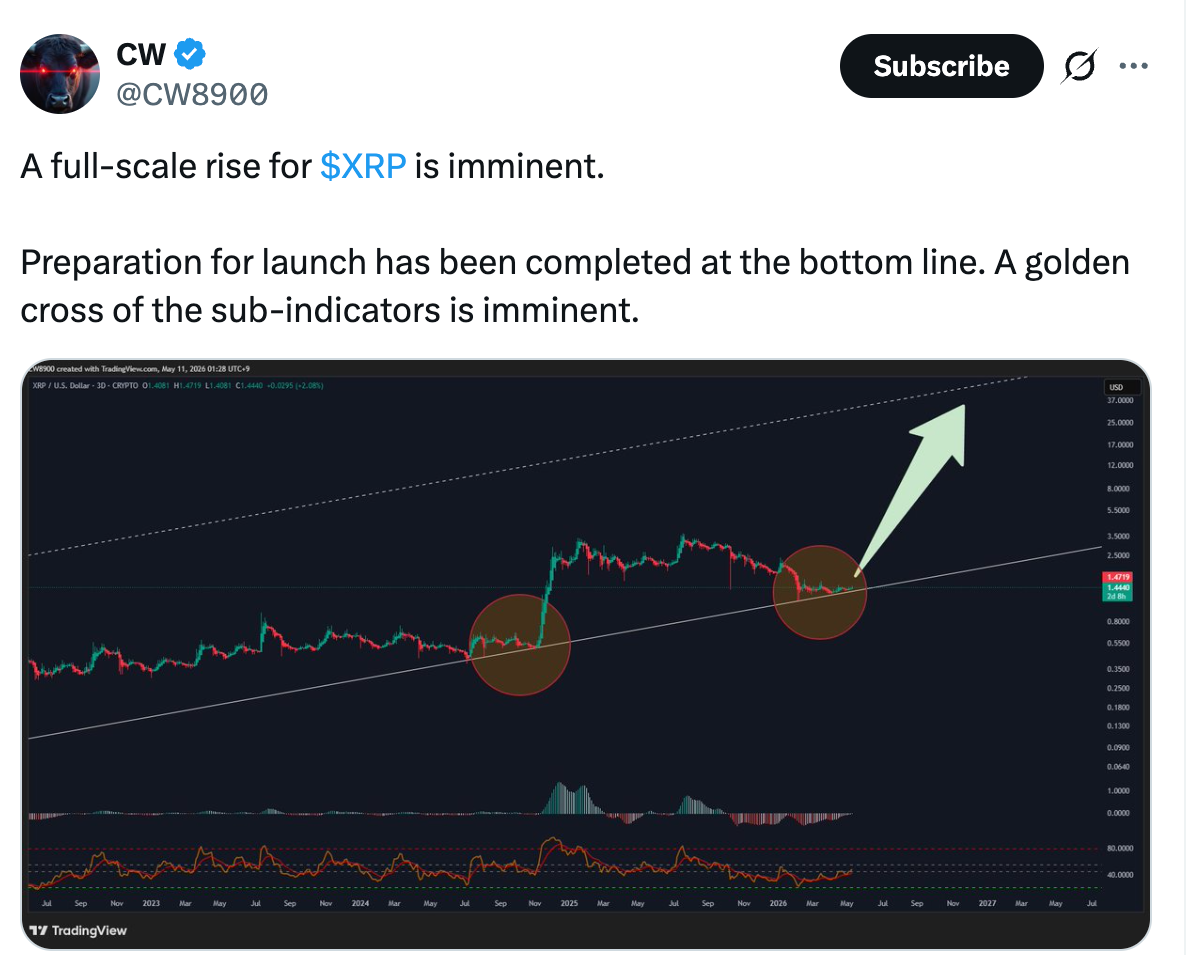
XRP/USD three-day chart. Source: X/CW8900
As Cointelegraph reported, buyers must break and sustain the XRP price above the $1.40- $1.61 seller congestion zone on the daily chart to signal a long-term trend shift.