, XRP, Shiba Inu (SHIB), Toncoin (TON) and Zcash (ZEC) Price Analysis for May 13: Hiding Explosive Volatility Potential – U.Today")
Despite the most recent rejection close to the $82,000 resistance level, Bitcoin is still structurally bullish. With the help of the rising trendline that keeps price action cohesive, the chart continues to display a clear series of higher lows since early April.
A few weeks ago, Bitcoin already reclaimed the 50-day and 100-day moving averages, which moved the overall market structure out of overtly bearish territory. Momentum exhaustion is currently the main problem.
Bitcoin has repeatedly failed to break above the local high of about $82,000, and volume is not growing rapidly during breakout attempts. RSI is likewise in the low-60s range; it is bullish, but not overly optimistic.
Bitcoin (BTC), XRP, Shiba Inu (SHIB), Toncoin (TON) and Zcash (ZEC) Price Analysis for May 13: Hiding Explosive Volatility Potential
1.3% of All XRP Now Unavailable Amid US ETF Rally; Vitalik Buterin Surprises Market With New SHIB-Style Donation; Bitcoin to $126,000: Arthur Hayes on New BTC Price High – Morning Crypto Report
This typically indicates a market that is still strong, but may require consolidation before continuing. The crucial aspect is that Bitcoin is also not collapsing.
Bulls are still vigorously defending the trendline, and the uptrend will continue as long as Bitcoin stays above the $78,000-$79,000 support cluster. The path to the mid-$80,000 range could be swiftly opened by a clear breakout above $82,000, which might later retest psychological highs.
Bitcoin may briefly return to the 100 EMA in the mid-$70,000s if macro conditions deteriorate or CPI data shows a negative surprise. However, the chart currently indicates that continuation is more likely than collapse.
XRP makes a comeback
After being stuck inside a large consolidation structure for months, XRP is at last beginning to show signs of life. The breakout above the descending resistance line that had limited price action since March is the chart’s most significant development.
This is significant from a technical standpoint because XRP has failed to maintain momentum in previous attempts to recover. It appears different this time.
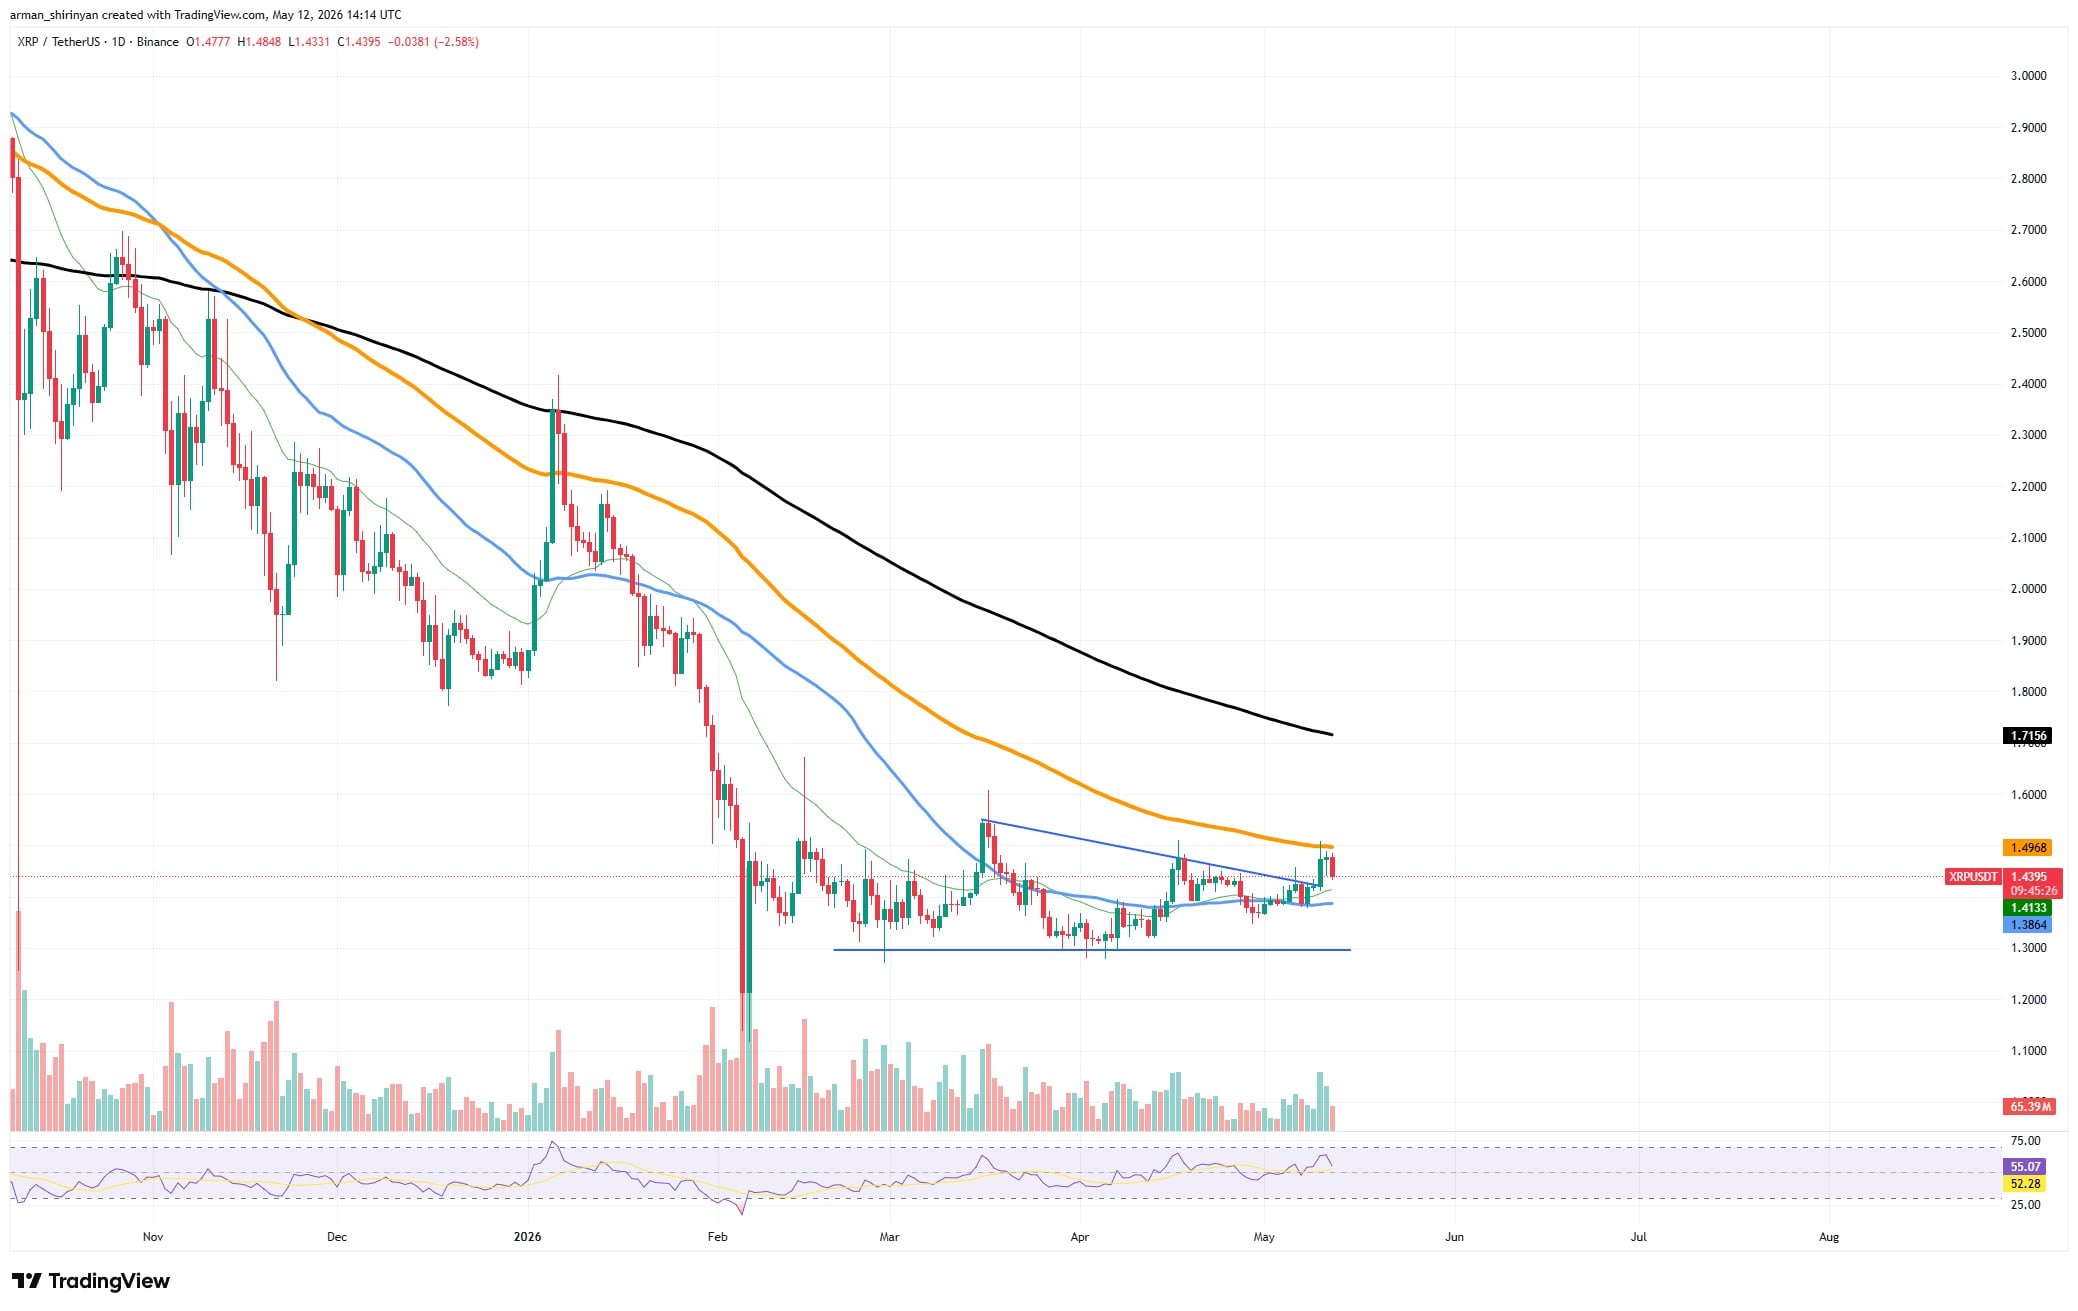
During the breakout, volume increased, price reclaimed short-term moving averages, and RSI moved toward bullish territory without overheating. Currently, the $1.50 area is still the crucial barrier.
By progressively gaining momentum above the 50 and 100 EMAs, XRP is trying to turn that level into support. The asset may enter a much stronger expansion phase aimed at the $1.60-$1.70 region if bulls are able to stabilize above present levels.
You Might Also Like

The 200 EMA overhead around $1.70-$1.72 is still an issue for XRP, though. On longer time periods, that level continues to be the true trend-reversal barrier.
The asset is technically still in the midst of a larger recovery rather than a confirmed bull trend until XRP decisively regains it. However, XRP appears to be much stronger now than it was in prior months.
Shiba Inu could be marking the recovery point
One of SHIB’s best technical setups in months is being quietly constructed. The current structure appears to be far healthier and more sustainable than previous meme-driven spikes that fell apart right away.
Since March, a steady ascending wedge with higher lows has been forming on the chart. Additionally, SHIB has recovered its short-term moving averages.
At $0.00000645, the 100 EMA resistance zone is currently being directly challenged. Breaking that level would be crucial from a technical standpoint since it has served as a ceiling for weeks.
You Might Also Like

Momentum is increasing gradually as opposed to rapidly, which is beneficial for the future. While volume remains largely stable, the RSI stays below extremely overbought territory.
This typically encourages gradual trend development rather than sudden blow-off peaks. The asset may enter a much larger recovery phase towards the 200 EMA overhead if SHIB breaks and holds above the 100 EMA.
Once market sentiment improves, meme coins often react violently, and SHIB is beginning to garner speculative interest once more. As usual, there is a risk of wider market weakness.
SHIB will probably lose steam quickly if Bitcoin flips over. However, SHIB is objectively in its best technical position since early March at the moment.
Toncoin’s additional push
Although the chart is beginning to display the first indications of post-rally instability, Toncoin is still one of the market’s strongest momentum assets.
In just a few days, TON surged from the $1.30 region to almost $3, thanks to significant speculative inflows and increased awareness of the Telegram ecosystem. The move was exceptional from a technical standpoint.
While volume increased sharply, TON cut nearly vertically through all of the major moving averages, including the 50, 100, and even 200 EMAs. Rather than being a straightforward short-term pump, that type of breakout typically indicates a significant shift in market interest.
You Might Also Like

After failing to maintain momentum above the local peak around $2.90, the chart now indicates that TON is entering a high-volatility consolidation phase near the $2.30-$2.50 range. Widening candle ranges and long upper wicks show that, as traders lock in gains from the vertical move, profit-taking pressure is rising.
Sustainability is currently the most crucial issue. Although there is still a lot of narrative momentum in TON, the asset quickly overheated. TON may retrace sharply toward the breakout area between $1.80 and $2.00 if the larger cryptocurrency market declines or Bitcoin goes into correction mode.
However, unless that zone completely collapses, the asset is still bullish structurally. The fact that TON recovered the 200 EMA after falling below it for several months is a significant long-term improvement for the chart.
Zcash gains market momentum
Although Zcash is currently one of the market’s most explosive performers, ZEC’s rally appears even riskier from a volatility standpoint than TON.
After breaking above the $350 resistance level, the asset went almost vertical. It then surged toward the $650 region before abruptly retracing. The magnitude of the move matters.
ZEC quickly reclaimed all of the major moving averages and drove the RSI far into overheated territory. Once speculative capital enters the market, privacy coins have historically experienced violent momentum cycles, and this rally nearly perfectly fits that pattern.
You Might Also Like

As of right now, the chart indicates that traders are starting to cool off. ZEC immediately encountered strong selling pressure following the spike toward $650, which caused the price to drop back toward the mid-$500 range. Recent candles with large upper shadows show that buyers are losing control at local highs.
Nevertheless, the overall structure is still bullish for the time being. After a protracted decline, ZEC is trading well above its major EMAs, and the 200 EMA itself is finally beginning to curve upward. The $500-$520 range is now the first significant support area, so momentum traders will probably keep a close eye on it.
The primary risk is straightforward: once speculative momentum wanes, assets that move vertically frequently retrace violently. Despite the strong breakout structure, ZEC could easily enter a much deeper correction phase if volume keeps falling and overall market conditions deteriorate.