
From a 2011 peak near $1,900, gold spent years carving a deep base, retested resistance around $2,100 in 2020, consolidated again through 2022, then broke decisively higher to reach $3,300 by early 2025 and a record above $5,400 in January 2026.
According to analyst and Real Vision affiliate James Easton, Bitcoin’s weekly chart is now drawing the same formation on a compressed timeline: a 2021 peak, a deep base through 2022 and 2023, a recovery and retest of prior highs in 2024 and early 2025, and a pullback that has left BTC sitting at the blue dot.
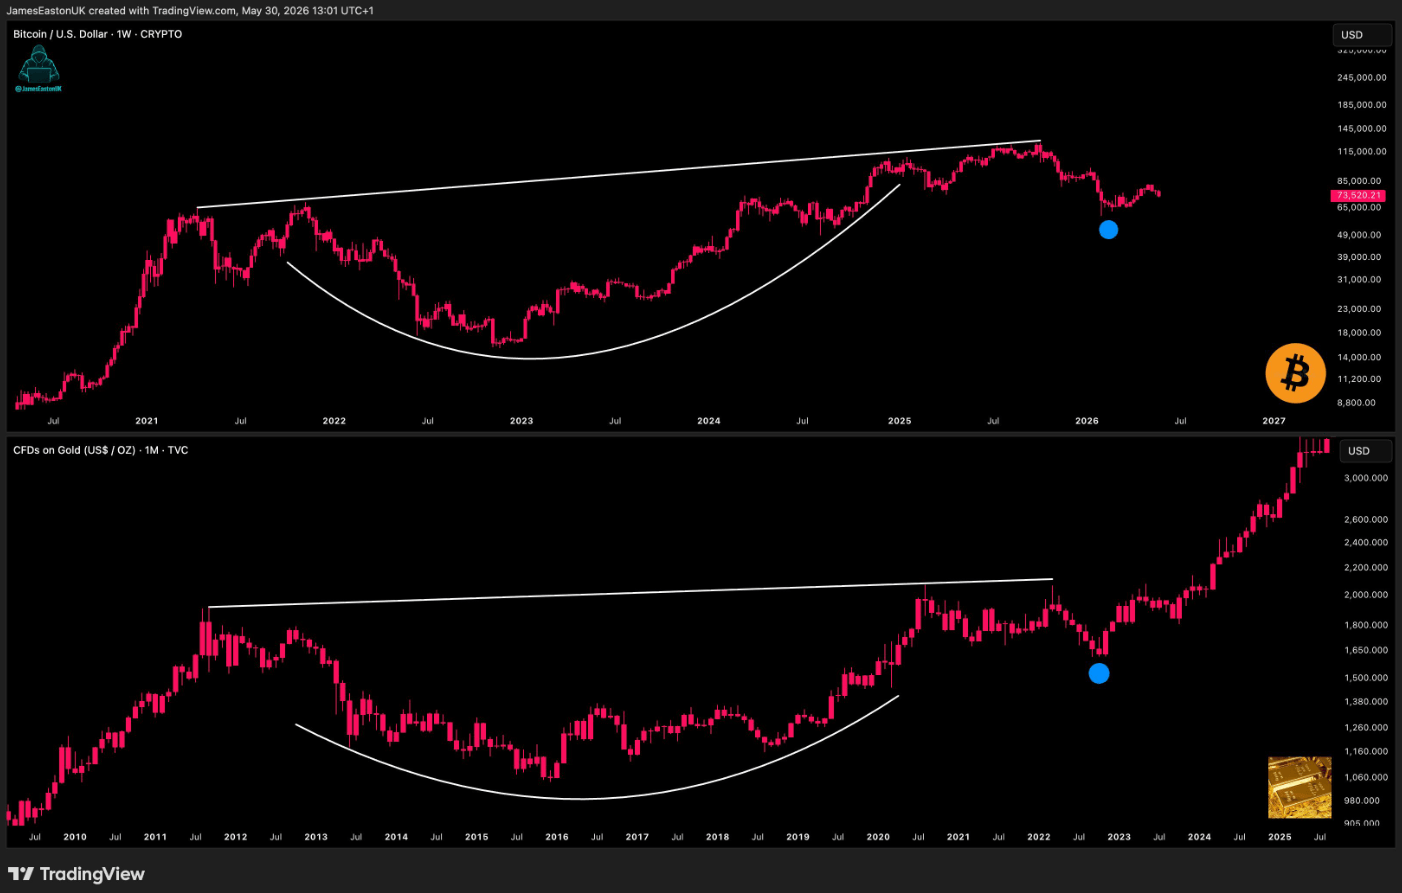
Traders overlaying the two structures are projecting a move to $300,000 for Bitcoin by the end of 2026 if the pattern holds, arguing that BTC is lagging gold’s repricing as a macro hedge asset.
The macro case for that lag closing looked compelling until June 1, when Brent crude jumped by over $6 per barrel to $97.14 after Iran’s Tasnim news agency reported Tehran had halted message exchanges with the US and that aligned groups were weighing measures to block the Strait of Hormuz.
Gold’s buyer base made the pattern stick
Gold’s cup-and-handle resolved because the dollar weakened, real yields fell, central banks accelerated reserve diversification away from US Treasuries, and geopolitical fragmentation made a non-sovereign hard asset structurally attractive.
World Gold Council data show central banks bought 244 tonnes net in the first quarter alone, the seventeenth consecutive quarter of net purchases, sustained even as prices sat 81% above year-ago levels.
Bar and coin demand rose 42% year-over-year to 474 tonnes, gold-backed ETFs added 62 tonnes, and total demand value hit a record $193 billion on a modest 2% volume gain.
The breakout had a buyer base that does not reprice on rate-hike fears because yield sensitivity is structurally irrelevant to a central bank building reserves.
Bitcoin’s pattern demands the same macro resolution from a buyer base with the opposite rate sensitivity: US spot Bitcoin ETFs logged ten consecutive trading days of net outflows through May 29, with nearly $3 billion drained during the period, according to Farside Investors data.
BlackRock’s IBIT shed roughly $2 billion during the streak, including a $527.8 million single-session exit on May 27.
An ETF holder reprices the position the moment oil pushes inflation expectations higher and rate-hike odds climb. Yield-sensitive institutional capital exits the moment oil pushes rate-hike odds higher, which is precisely what it is doing now.
| Breakout ingredient | Gold | Bitcoin | Why it matters |
|---|---|---|---|
| Structural demand | Central banks bought 244 tonnes net in Q1 | No central-bank equivalent | Gold has sovereign reserve demand |
| ETF behavior | Gold ETFs added 62 tonnes | BTC ETFs saw nearly $3B in outflows | BTC demand is more macro-sensitive |
| Retail demand | Bar and coin demand +42% YoY | Mostly ETF/institutional-led in article frame | BTC reprices faster when conditions tighten |
| Rate sensitivity | Lower for central-bank reserve buyers | Higher for ETF/institutional holders | Oil-driven Fed fears hit BTC harder |
| Pattern status | Breakout completed | Breakout conditional | BTC still needs macro confirmation |
The oil problem
The Strait of Hormuz carries 20.9 million barrels per day, roughly 20% of global petroleum liquids consumption, according to EIA data.
The Dallas Fed estimates that a two-quarter closure of the Strait of Hormuz would add 0.79 percentage points to the fourth-quarter headline PCE and 0.31 percentage points to core PCE.
On June 1, CME FedWatch data showed traders pricing roughly a 56% chance of at least one US rate hike by year-end. When rate-hike odds rise, the dollar firms, real yields move higher, and liquidity-sensitive assets reprice lower.
Gold fell nearly 2% on June 1 as that transmission ran through yields, confirming that even the completed breakout struggles when the shock arrives via rates. Bitcoin faces that transmission more directly, with a record 0.96 correlation to US equities during the war shock period.
The pattern on the chart requires BTC to behave as gold did at the equivalent blue dot: absorbing selling pressure, holding the base, and accelerating as macro conditions ease.
The pattern survives if oil finds a ceiling
EIA’s May short-term energy outlook forecasts Brent averaging around $106 in May and June, before easing to $89 in the fourth quarter of 2026 and $79 in 2027 as Middle East production recovers.
The IEA projects a 420,000 b/d contraction in demand in 2026, adding fundamental weight to a supply ceiling.
If that path holds before the Fed actually hikes, financial conditions ease, rate-hike odds fade, and the same forces that drove gold’s cup-and-handle resolution become available to Bitcoin: dollar weakness, falling real yields, and institutional reallocation into hard assets.
Bitcoin’s 30-day annualized perpetual basis had slipped to -0.45% as of mid-May, against 3.16% a year earlier, a spot-led structure with minimal leverage overlay. The same accumulation profile preceded gold’s durable breakout.
VanEck identified the $80,000-$85,000 zone as the key resistance to reclaim for momentum to shift, and Citi’s bull case sits at $165,000 within 12 months. The $300,000 requires a melt-up that extends well beyond institutional consensus and demands sustained ETF inflows to compress the available float against rising demand.
The formation fails
If Hormuz disruption extends for two or more quarters, the Dallas Fed’s inflation model puts headline PCE 0.79 percentage points higher by the fourth quarter, enough to make a Fed hike more likely than not and ETF outflows self-reinforcing.
Citi’s recessionary scenario sits at $58,000, and at that level, the cup-and-handle formation on Bitcoin’s weekly chart transitions from a base to a failed breakout, resetting the pattern clock entirely.
Peter Brandt, who set a $300,000-$500,000 target for Bitcoin in April 2026, framed it as contingent on the four-year cycle holding, a caveat that applies with full force when oil threatens to reprice the Fed’s path.
| Scenario | Oil / macro condition | Fed path | Bitcoin implication | Key level |
|---|---|---|---|---|
| Pattern survives | Oil finds a ceiling; Brent follows EIA easing path | Hike odds fade | ETF pressure eases, chart remains valid | $80K–$85K reclaim |
| Consensus bull | Dollar weakens, real yields fall, inflows resume | Liquidity improves | BTC moves toward institutional bull case | $165K |
| Pattern fails | Hormuz disruption lasts two quarters | Inflation pressure rises | ETF outflows become self-reinforcing | $58K |
| Melt-up case | Gold-lag trade fully closes | Easing/liquidity returns | BTC overshoots consensus | $300K stretch target |
Gold benefits from war risk as central banks buy more, Asian retail demand accelerates, and ETF holders rotate in. Bitcoin reaches the same destination only through a second-order path, where geopolitical stress must translate into dollar weakness and monetary easing, a sequence that an oil-driven inflation shock actively forecloses.
Whether Bitcoin can complete gold’s version of the formation depends entirely on whether oil stops rising before it locks in the rate environment that would make the pattern impossible.