, Ethereum (ETH) and Hyperliquid (HYPE) Price Analysis for June 8: Are Top-Tier Assets Ready to Bounce? – U.Today")
Despite a slight recovery from recent lows, XRP is still among the market’s weakest large-cap assets.
The asset accelerated downward after breaking below the crucial $1.30 support zone, briefly touching the $1.05-$1.10 range before drawing buyers. Although XRP has returned to $1.12 due to the current bounce, the overall trend is still very negative.
XRP is technically trading below all of the major moving averages. The persistent long-term weakness is reflected in the 50-day, 100-day, and 200-day trend indicators, which are still sloping downward. More significantly, the area around $1.30 that was once support has turned into resistance. If the asset gets close to that region, there will probably be strong selling pressure on any attempt at recovery.
XRP, Bitcoin (BTC), Ethereum (ETH) and Hyperliquid (HYPE) Price Analysis for June 8: Are Top-Tier Assets Ready to Bounce?
Schiff: 99% Crash Wouldn’t Phase Bitcoin ‘Cult’
A significant bearish continuation pattern that had been forming for months was completed by the most recent decline. During the breakdown, volume increased, indicating that sellers are still in charge. Even though the daily RSI has reached extremely oversold levels, in significant downtrends, oversold conditions by themselves seldom indicate the final bottom.
Bulls should take heart from the fact that panic selling seems to be slowing down. The most recent candles indicate that buyers are entering the $1.05 area, indicating that short-term traders are prepared to defend the level.
You Might Also Like

To indicate any significant trend reversal, XRP would need to recover at least $1.30 and eventually the moving averages above. As of right now, the most likely scenario is ongoing volatility interspersed with sporadic upturns.
In the coming months, XRP may revisit the recent lows and possibly investigate lower support zones if the broader cryptocurrency weakness continues.
Bitcoin enters stabilization period
After going through one of its biggest declines of the year, Bitcoin has stabilized around $61,000. Before buyers appeared, the asset briefly fell toward the $60,000 mark, resulting in a minor relief bounce.
Even with the recovery, the technical picture is still precarious. The clear break below the 50-day and 100-day moving averages is the most significant development. Additionally, during its last attempt at recovery, Bitcoin was unable to regain the 200-day moving average near $80,000, indicating that long-term momentum is still negative.
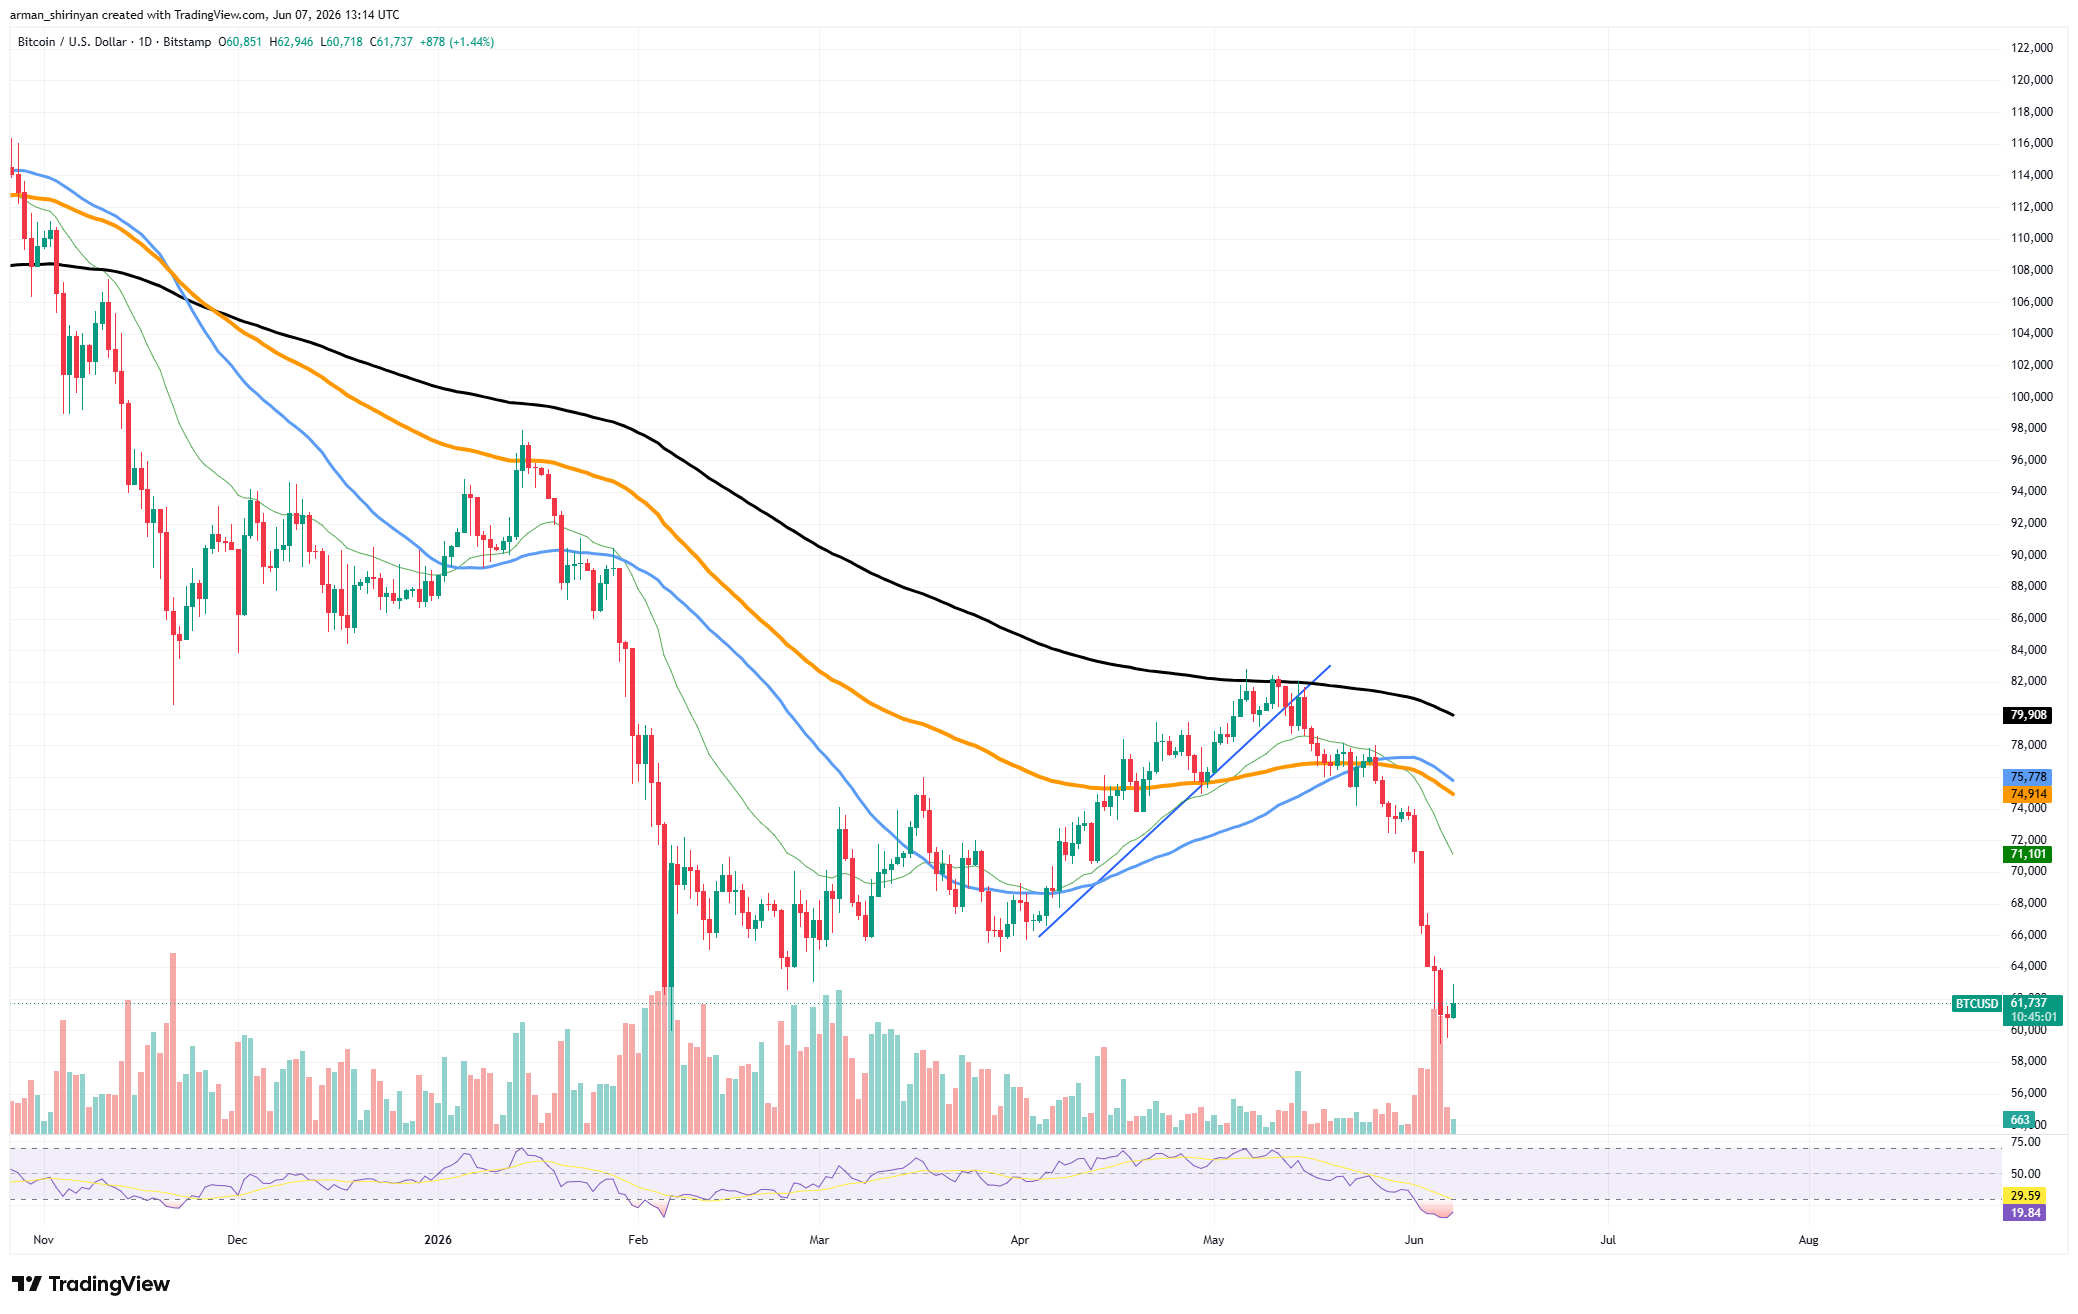
During the most recent sell-off, volume skyrocketed, suggesting a capitulation event rather than regular profit-taking. The daily RSI has fallen to extremely oversold levels, close to 20, which are typically linked to panic. Relief rallies are frequently preceded by such readings, but this does not mean that the final bottom has formed.
The crucial battleground is currently the $60,000 area. Bitcoin may try to rebound toward $70,000 and the cluster of moving averages above if buyers are successful in defending it. A sustained break below present levels, however, would expose the market to a more severe decline toward the $55,000–$50,000 range, where there is more historical support.
Bitcoin seems to be oversold and ready for a comeback in the near future. Whether that bounce turns into a true trend reversal or just another rally within a larger bearish framework is the question.
Sellers continue to have an advantage until Bitcoin reclaims the major moving averages overhead.
Ethereum turning things around
After one of the biggest drops of the year, Ethereum has entered a critical phase. Before buyers intervened, the asset momentarily fell below the psychologically significant $1,600 level, resulting in a relief bounce back toward $1,620.
Although there is some short-term hope due to the rebound, the overall technical picture is still strongly skewed downward. Bearish continuation was effectively confirmed by the break from the descending consolidation pattern that developed during April and May. When ETH failed to maintain support close to its 100-day and 200-day moving averages, stop-losses were triggered throughout the market, accelerating the subsequent sell-off.
You Might Also Like
Ethereum currently trades below all significant moving averages from a technical standpoint. The strength of the current downward trend is demonstrated by the 50-day, 100-day, and 200-day averages, which are still pointing lower. Simultaneously, the RSI has entered extremely oversold territory, which typically precedes brief recovery rallies.
The $1,800-$2,000 range is the first region traders will keep an eye on. It is currently the closest major resistance zone and served as support in the past. There may be significant selling pressure from trapped holders trying to exit their positions if there is a bounce toward those levels.
Despite the bearish structure, the current sell-off might be nearing short-term exhaustion. During the decline, volume increased significantly, indicating conditions akin to capitulation. These spikes frequently accompany panic selling incidents before markets stabilize.
Ethereum is still heavily dependent on the performance of Bitcoin, though. ETH might revisit recent lows and possibly test deeper support levels if BTC keeps declining. Ethereum would need to reclaim the major moving averages and set higher highs in order for bulls to regain significant control, but this seems unlikely at the moment.
Right now, the market is still in damage control mode. Until proven otherwise, the longer-term trend is still negative, but the short-term outlook favors volatility and relief rallies.
Hyperliquid loses steam
Despite a severe decline from recent highs, Hyperliquid is still among the best performers in the digital asset market. HYPE experienced a sharp decline that momentarily moved the token toward the mid-$50 range before buyers returned following a surge to almost $76.
HYPE is still well above its important long-term moving averages, unlike the majority of major cryptocurrencies. A structurally bullish market is indicated by the 100-day and 200-day trend indicators, which are still sloping upward. The asset trades well above those support levels even after the most recent correction, suggesting that long-term momentum is still present.
Rather than a true trend reversal, the recent decline seems more consistent with profit-taking. Traders frequently lock in gains after an explosive rally, which temporarily creates selling pressure. This dynamic seems especially relevant given how rapidly HYPE gained popularity during the prior advance.
You Might Also Like

The maintenance of the broader uptrend structure is one significant technical factor. Over a longer period, the rising support line that led the asset higher throughout the spring is still in place. The long-term pattern is still valid even though the short-term momentum has diminished.
Overbought conditions have caused the RSI to cool significantly, which may eventually help the asset by resetting speculative excess. When selling pressure lessens, a stronger momentum profile frequently serves as the basis for upcoming gains.
The recent highs between $70 and $76 continue to be important resistance. HYPE may eventually attempt another move toward those levels if buyers are successful in defending the current support region and volume returns. On the other hand, a break below the $50 mark would be a more dire warning and might indicate a more significant correction.
Hyperliquid continues to be one of the best relative performers compared to much of the cryptocurrency market. Even though volatility remains high, the general trend is still in favor of bulls unless significant support zones start to collapse.