The Bitcoin (BTC) price broke out from its pattern while the crypto market cap (TOTALCAP) moved down. A horizontal resistance area rejected BLUR.
Today in crypto:
- Digital Prime Technologies announced the launch of a new crypto lending platform called Tokenet.
- The Deputy Treasury Secretary of the US urged Congress to increase efforts against the use of cryptocurrencies by militant groups.
Crypto Market Cap (TOTALCAP) Nears End of Bearish Pattern
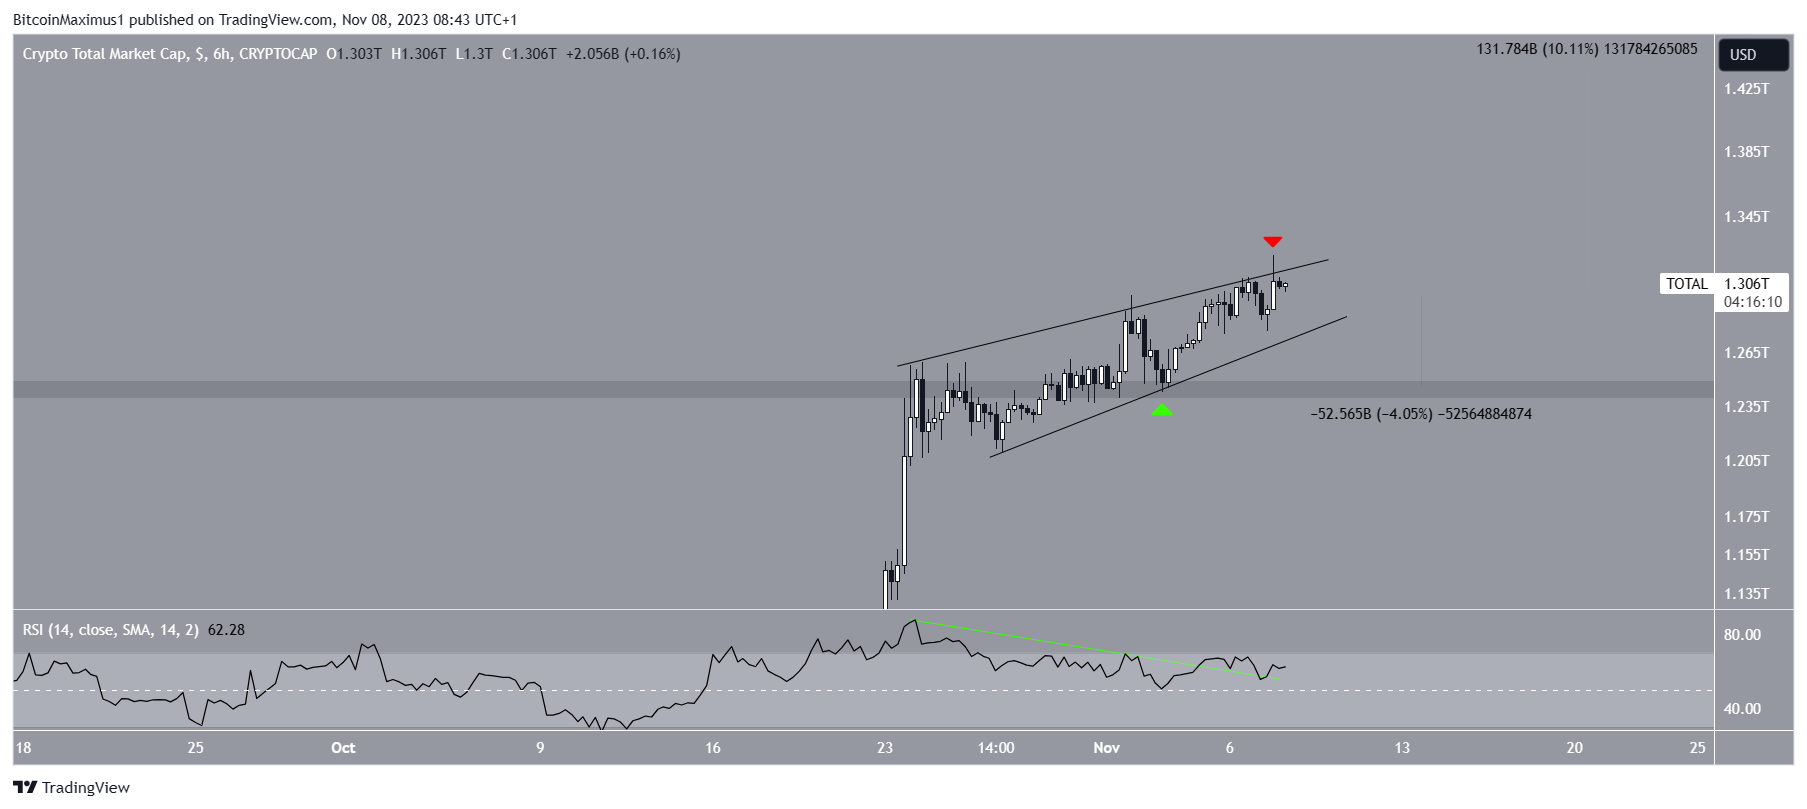
TOTALCAP has been trading inside an ascending wedge since October 23.
Since the ascending wedge is considered a bearish pattern, a breakdown from it would be the most likely future price outlook. Currently, TOTALCAP is near the wedge’s resistance trendline after making an unsuccessful breakout attempt yesterday (red icon).
The price action and the Relative Strength Index (RSI) are not in alignment. Despite the price action showing a bearish pattern, the RSI is bullish.
Read More: 9 Best AI Crypto Trading Bots to Maximize Your Profits
With the RSI as a momentum indicator, traders can determine whether a market is overbought or oversold and decide whether to accumulate or sell an asset.
Bulls have an advantage if the RSI reading is above 50 and the trend is upward. But if the reading is below 50, the opposite is true.
Currently, the indicator is increasing and is above 50. It also broke out from its bearish divergence trendline (green).
The future direction of the trend hinges on whether TOTALCAP experiences a breakout from the wedge or faces rejection. A successful breakout has the potential to result in a 10.50% rise to the subsequent resistance level of $1.43 trillion.
Conversely, a breakdown from the wedge could lead to a 4% decline towards the support area of $1.25 trillion.
Bitcoin Breaks Out From Triangle
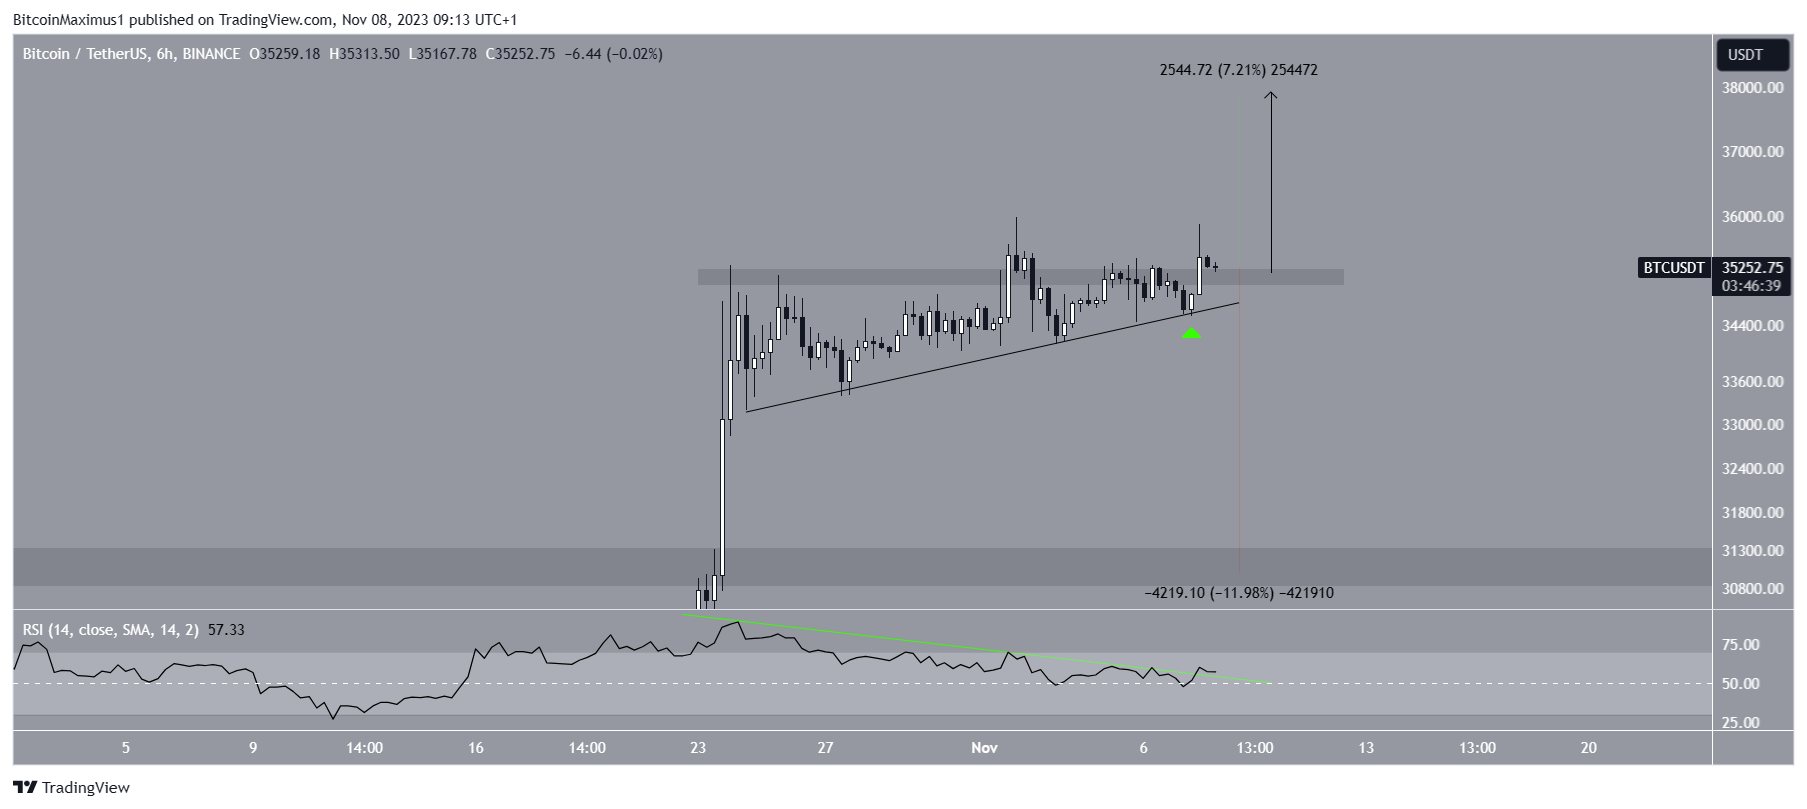
The BTC price fell after reaching a new yearly high of $35,984 on November 2. The decrease that followed caused a deviation above the $35,200 resistance area and took the price back to an ascending support trendline.
The price bounced at the trendline yesterday (green icon) and broke out from the $35,200 area, nearly reaching a new yearly high.
Read More: 9 Best Crypto Demo Accounts For Trading
Combined, the trendline and the resistance area create an ascending triangle, which is often considered a bullish pattern. This bullish price action is supported by the RSI, which has broken out from its bearish divergence trendline.
A breakout that travels the entire pattern’s height would take BTC to $38,000, a 7% increase from the current price.

Despite this bullish BTC price prediction, a fall below the $35,200 area and close below the ascending support trendline could potentially initiate a 12% drop to the closest support at $31,000.
BLUR Price Falls After Rejection
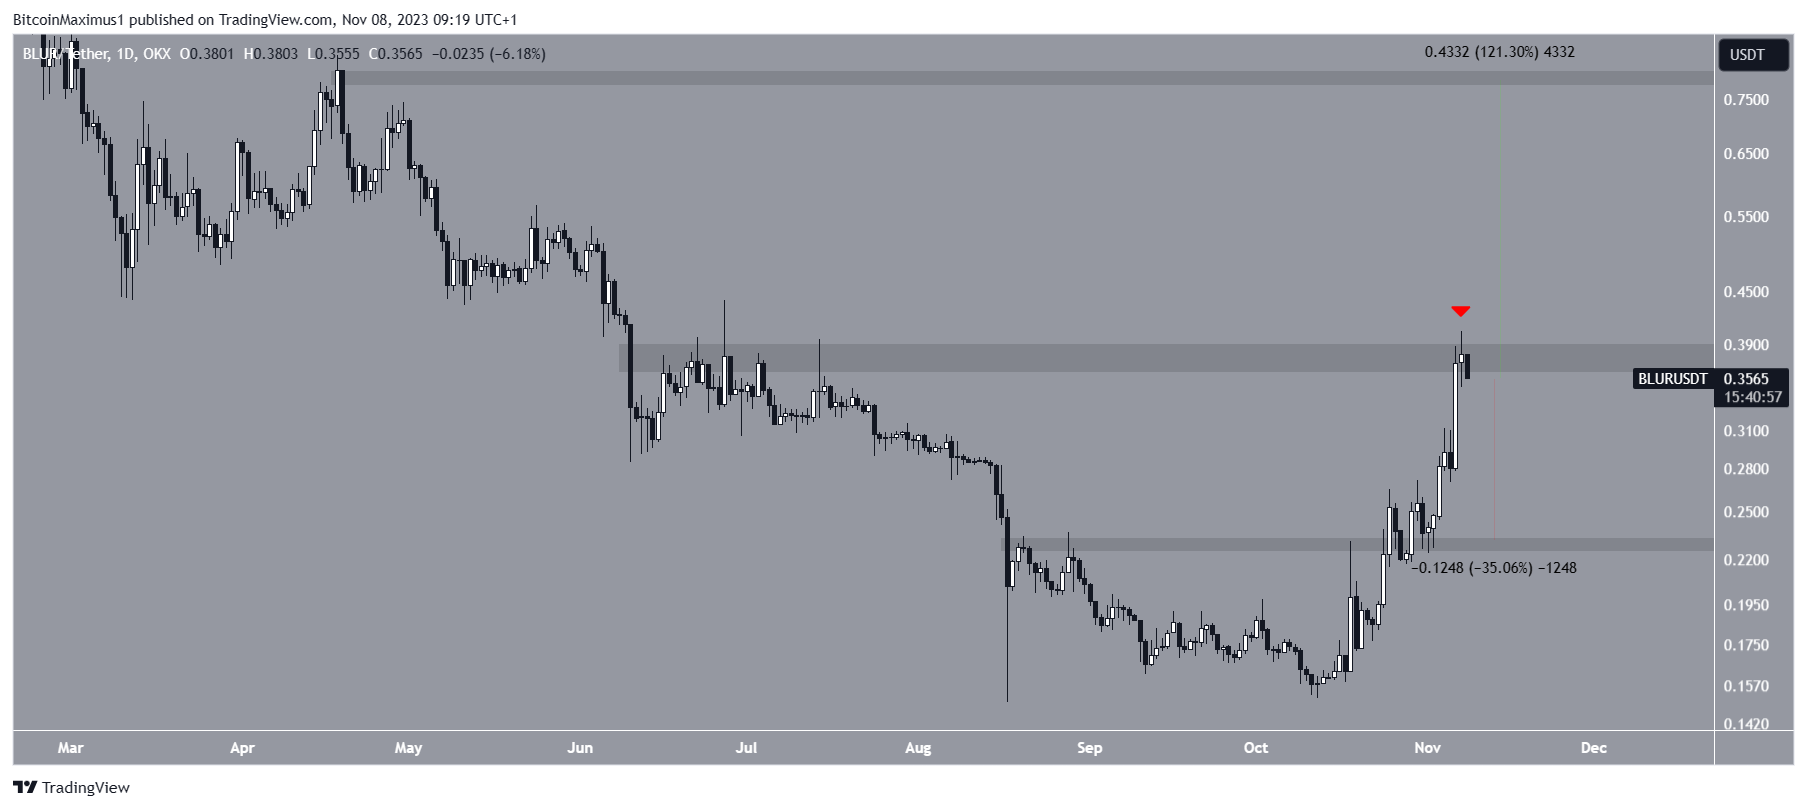
The BLUR price has increased since October 12. The upward movement culminated with a high of $0.40 on November 7. The high was made inside the $0.28 horizontal resistance area, which has been in place since June.
The BLUR price failed to break out on its first attempt. Instead, it created an upper wick (red icon) and fell.

If BLUR continues to fall, the closest support would be found at $0.23, 35% below the current price. On the other hand, reclaiming the $0.38 area could lead to a 120% increase to the next resistance at $0.78.
Read More: Top 9 Telegram Channels for Crypto Signals in 2023
For BeInCrypto‘s latest crypto market analysis, click here.
Best crypto exchanges in Europe | November 2023
Paybis
Paybis” target=”_blank”>No fees for 1st swap →
YouHodler
YouHodler” target=”_blank”>Free cloud miner →
Wirex
Wirex” target=”_blank”>1000 WXT for KYC →
INX
INX” target=”_blank”>No fees for 30 days →
OKX
OKX” target=”_blank”>Up to $10,000 →
The post Why Is the Crypto Market Down Today? appeared first on BeInCrypto.
