The crypto market cap (TOTALCAP) and the Bitcoin (BTC) price have increased since August 17. However, neither has broken out from their respective resistance levels. Astar (ASTR) risks breaking down from an ascending parallel channel.
Google announced that it is expanding its cloud operations into El Salvador. Since the latter has fully legalized Bitcoin as tender, this sparked speculations about a Bitcoin-related motive.
Crypto Market Cap (TOTALCAP) Bounces But Fails to Clear Resistance
The TOTALCAP price has decreased under a descending resistance line since reaching a yearly high of $1.22 trillion on July 13. The decrease led to a low of $992 billion on August 17. This caused a breakdown from the $1.12 trillion horizontal support area.
While the price has increased significantly since August 17, it has yet to break out from the descending resistance line (red icon).
If TOTALCAP breaks out, it can increase by 5% and reach the $1.12 trillion horizontal resistance area. On the other hand, failure to break out will likely lead to a 6% drop in the $1 trillion horizontal support area.
Read More: Get Bitcoin (BTC) Price Predictions Here
Bitcoin (BTC) Price Approaches Critical Resistance
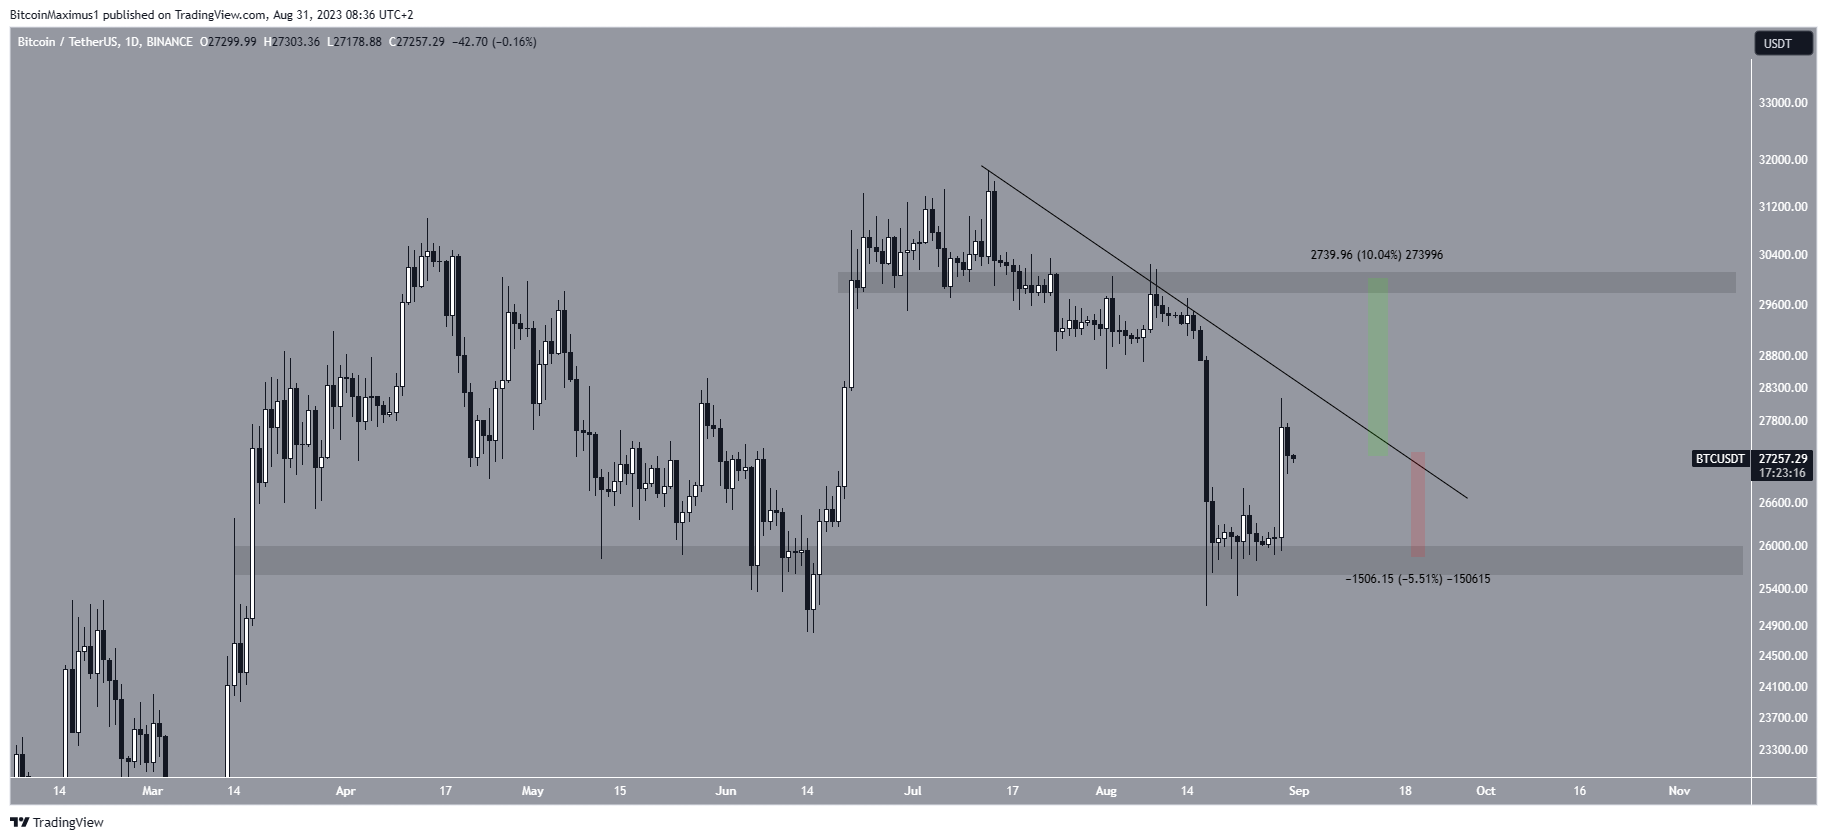
Similarly to TOTALCAP, the BTC price bounced sharply on August 17 and has increased since. The increase took the price close to a descending resistance line that has existed since July 13. While the BTC price is very close to reaching the area, whether it breaks out or gets rejected can determine the future trend.

In case of a breakout, a 10% price increase to the next resistance at $30,000 will be expected. However, a rejection from the line can lead to a nearly 6% drop to the closest support at $25,800.
Check Out the 9 Best AI Crypto Trading Bots to Maximize Your Profits
Astar (ASTR) Price Risks Breakdown From Pattern
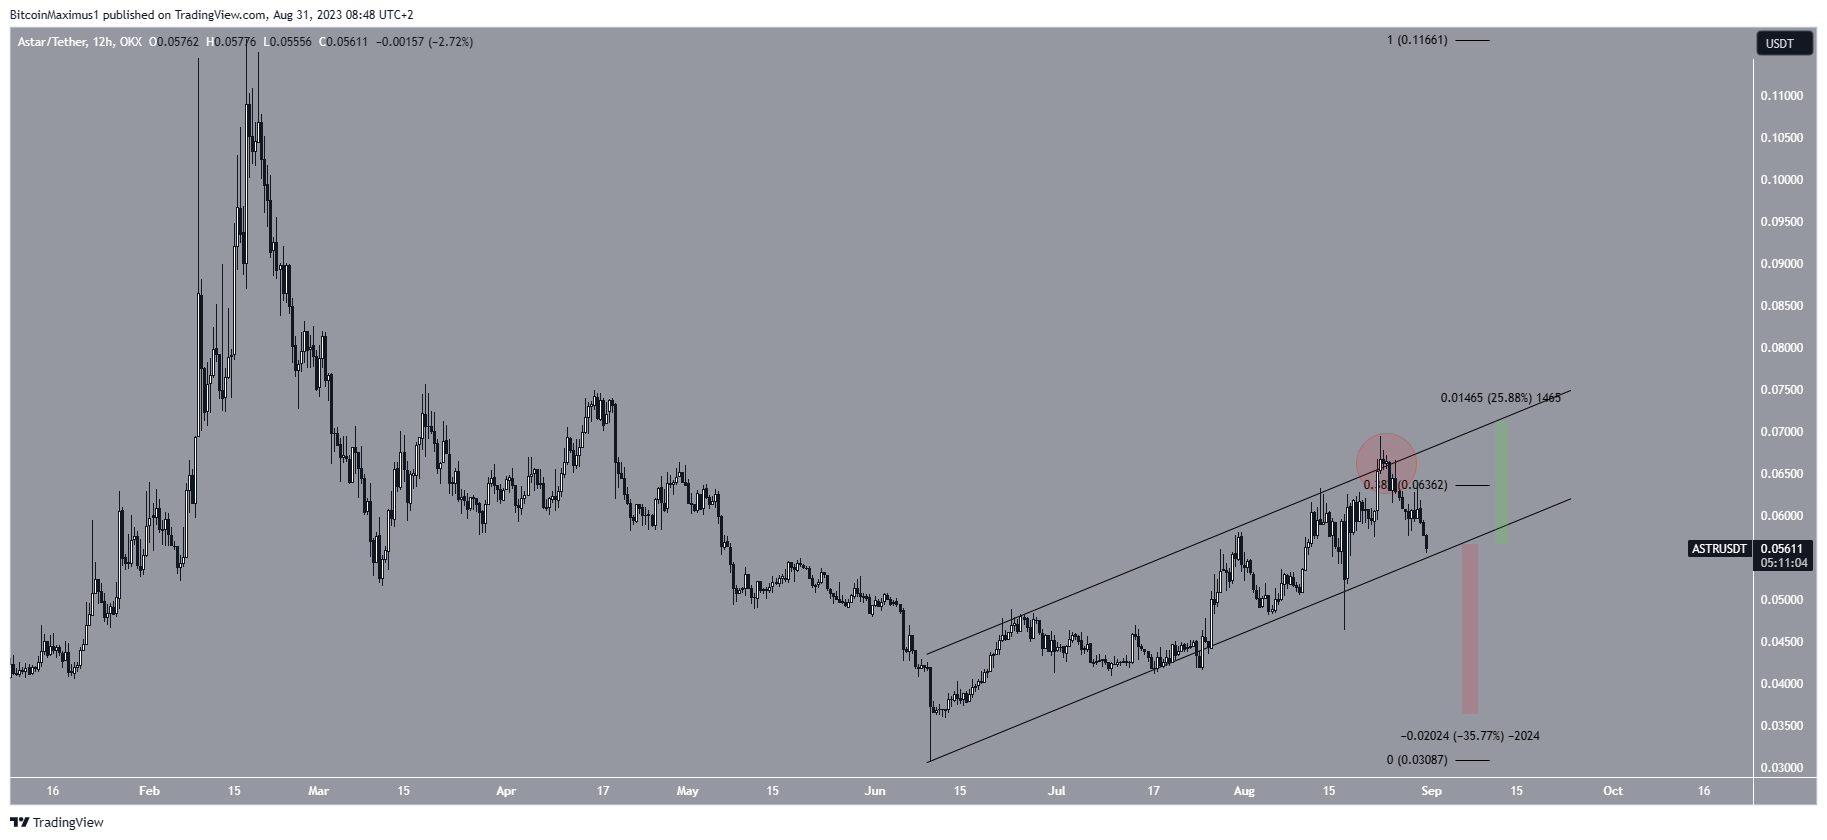
The ASTR price has increased inside an ascending parallel channel since June 11. The ascending parallel channel is considered a corrective pattern. Therefore, an eventual breakdown from it is the most likely scenario.
On August 24, ASTR was rejected by the channel’s resistance line (red circle). It has fallen since and is trading close to the channel’s support line.

A breakdown from the channel can lead to a 35% drop to $0.036. On the other hand, a bounce at the channel’s support line can lead to a 26% price increase to the channel’s resistance line at $0.071.
Looking For a New Exchange? These Are the Best Crypto Sign-Up Bonuses in 2023
For BeInCrypto’s latest crypto market analysis, click here.
The post Why Is the Crypto Market Down Today? appeared first on BeInCrypto.
