 Price Closes Six Bullish Weeks – Can It Go for Seven?")
Since October, the Cardano (ADA) price has created six successive bullish weekly candlesticks.
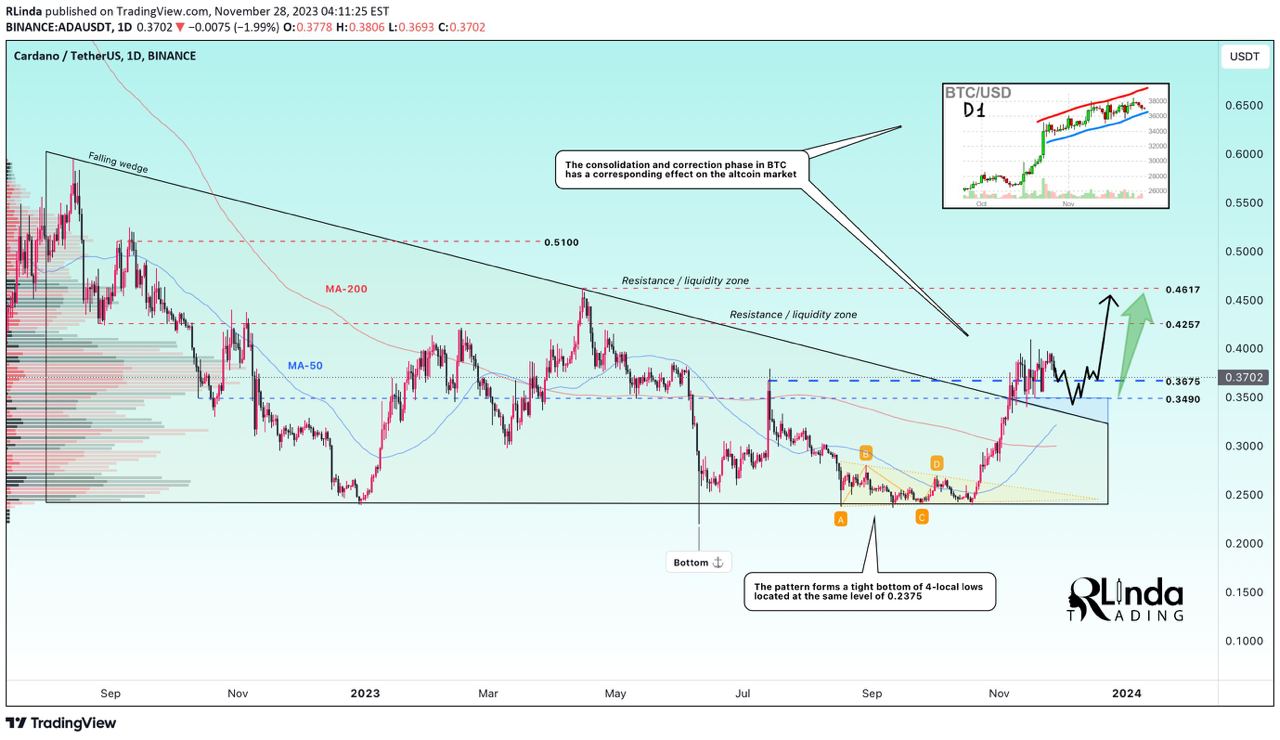
The ADA price broke out from a short-term horizontal resistance but has yet to move above a long-term one. Will it do so?
Cardano Struggles at Range High
The technical analysis of the weekly timeframe shows that the ADA price has increased swiftly since October 16 (green icon). Since then, the price has created six successive bullish weekly candlesticks.
The ADA price increase culminated with a high of $0.41 two weeks ago but did not break out from a long-term range, which has been in place for more than a year. Rather, it created a long upper wick (red icon) and fell slightly.
Market traders use the Relative Strength Index (RSI) as a momentum indicator to identify overbought or oversold conditions and to decide whether to accumulate or sell an asset.
Readings above 50 and an upward trend indicate that bulls still have an advantage, whereas readings below 50 suggest the opposite.
The RSI is increasing and above 50, both signs of a bullish trend.
Read More: 9 Best Crypto Demo Accounts For Trading
What Do the Traders Say?
Cryptocurrency traders and analysts on X do not agree on the future ADA price movement.
RLinda believes the price has completed its corrective phase due to the breakout from a long-term resistance trend line.
CryptoBusy suggested that a breakout from the current long-term resistance level can greatly accelerate the rate of increase. He stated that:
This price level has been flipping between support and resistance zones for more than 2000 days. And just one of the technical reasons why $ADA‘s price is not going higher right now. If the price breaks through this resistance, we could see a massive move to the upside!
BigChonis noted the importance of the same resistance area but does not believe the price will break out.
Read More: Top 9 Telegram Channels for Crypto Signals in 2023
ADA Price Prediction: Will the Upward Movement Continue?
While the weekly chart offers mixed signs, the daily timeframe RSI and price action suggest that the ADA price increase will continue.
This is because of both the ADA price action and the RSI readings.
The price movement shows that ADA reclaimed the $0.35 horizontal resistance area during the upward movement.
After doing so, the daily RSI generated a hidden bullish divergence (green). This occurs when a momentum decrease accompanies a price increase, often leading to trend continuation.
If the divergence materializes, it will lead to a 17% ADA price increase to the next resistance at $0.45.
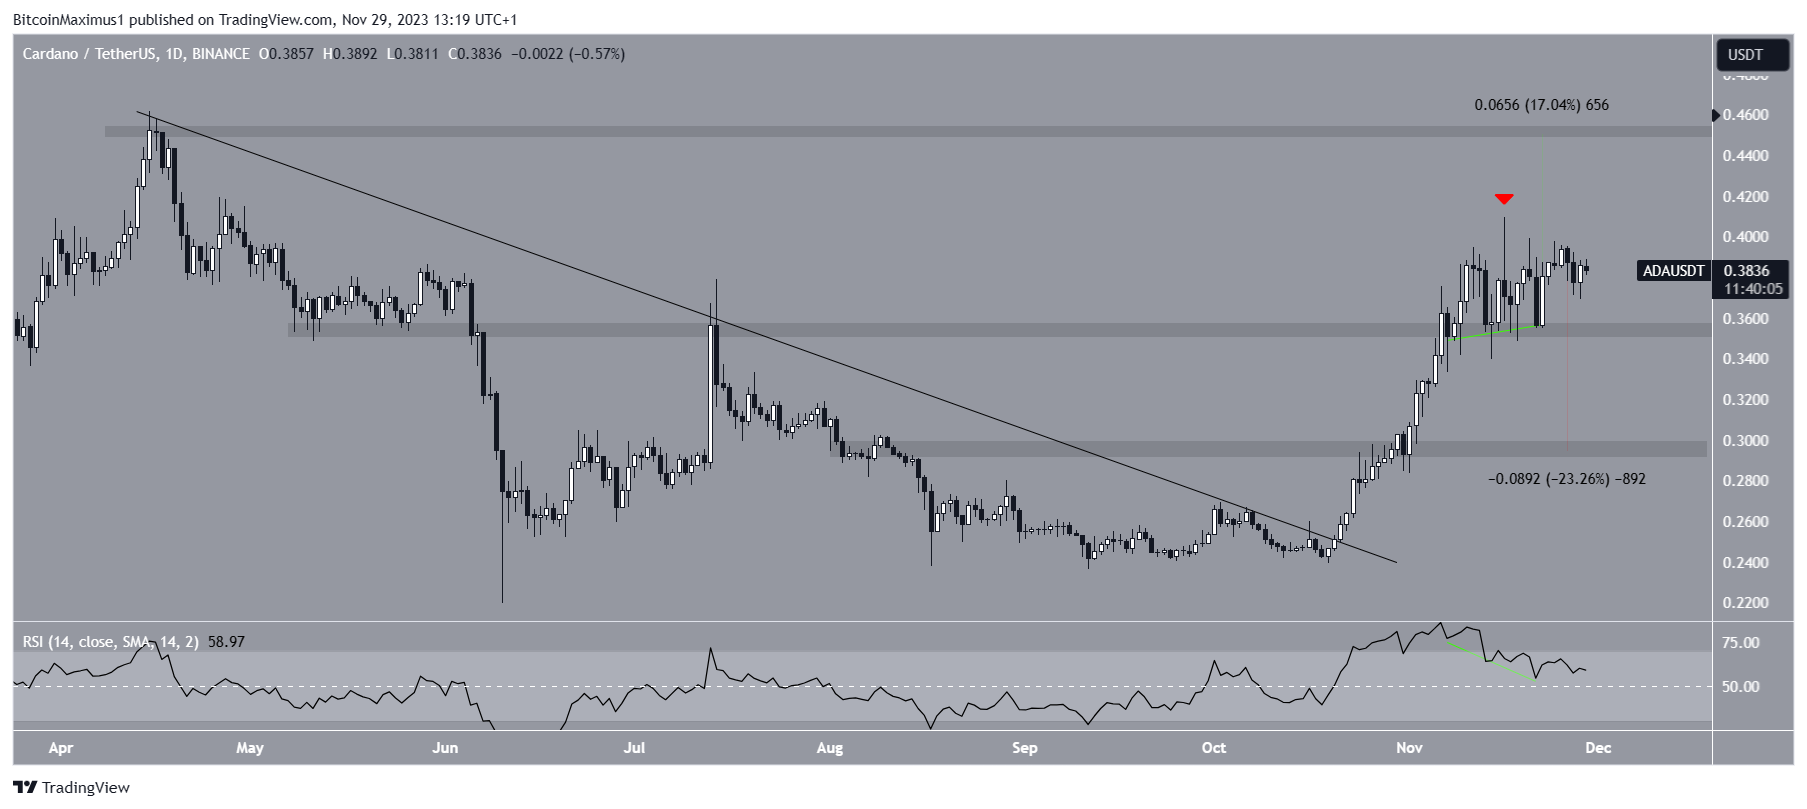
This bullish ADA price prediction will be invalidated with a close below the $0.35 horizontal resistance area. In that case, the ADA price can fall by 23% to the next support at $0.30.
How to Stake Cardano? A Complete Guide for Beginners – YouTube
For BeInCrypto’s latest crypto market analysis, click here.
Top crypto platforms | November 2023
![]()
Kraken
Kraken” target=”_blank”>Up to 24% APY →
![]()
Bitsgap
Bitsgap” target=”_blank”>-50% on annual plan
![]()
BYDFi
BYDFi” target=”_blank”>No KYC →
![]()
INX
INX” target=”_blank”>No fees 30 days →
The post Cardano (ADA) Price Closes Six Bullish Weeks – Can It Go for Seven? appeared first on BeInCrypto.