An on-chain indicator from CryptoQuant is currently forming a pattern that could suggest a bearish turn might take place for Bitcoin.
Bitcoin Whales Seem To Be Going Risk-Off Mode Currently
As explained by CryptoQuant founder and CEO Ki Young Ju in a post on X, the BTC whales have appeared to have been shifting towards a risk-off mentality recently.
The indicator of interest here is the “Inter-exchange Flow Pulse” (IFP), which keeps track of the Bitcoin flows taking place between spot and derivative exchanges.
When the value of this metric goes up, it means that the amount of BTC going from spot to derivative platforms is rising right now. Such a trend can suggest that big players like the whales are showing an interest in opening up higher-risk positions on the derivative exchanges.
Historically, an uptrend in the indicator has coincided with bull runs for the cryptocurrency. “The strategy seeks to get exposure to Bitcoin when the IFP is trending upward,” explains the CryptoQuant dashboard for the metric.
On the other hand, the IFP heading down suggests the flows from spot to derivative exchanges are declining, a potential sign that the whales have started to cut back on their appetite for risk. Bearish periods in the asset have usually coincided with this kind of trend.
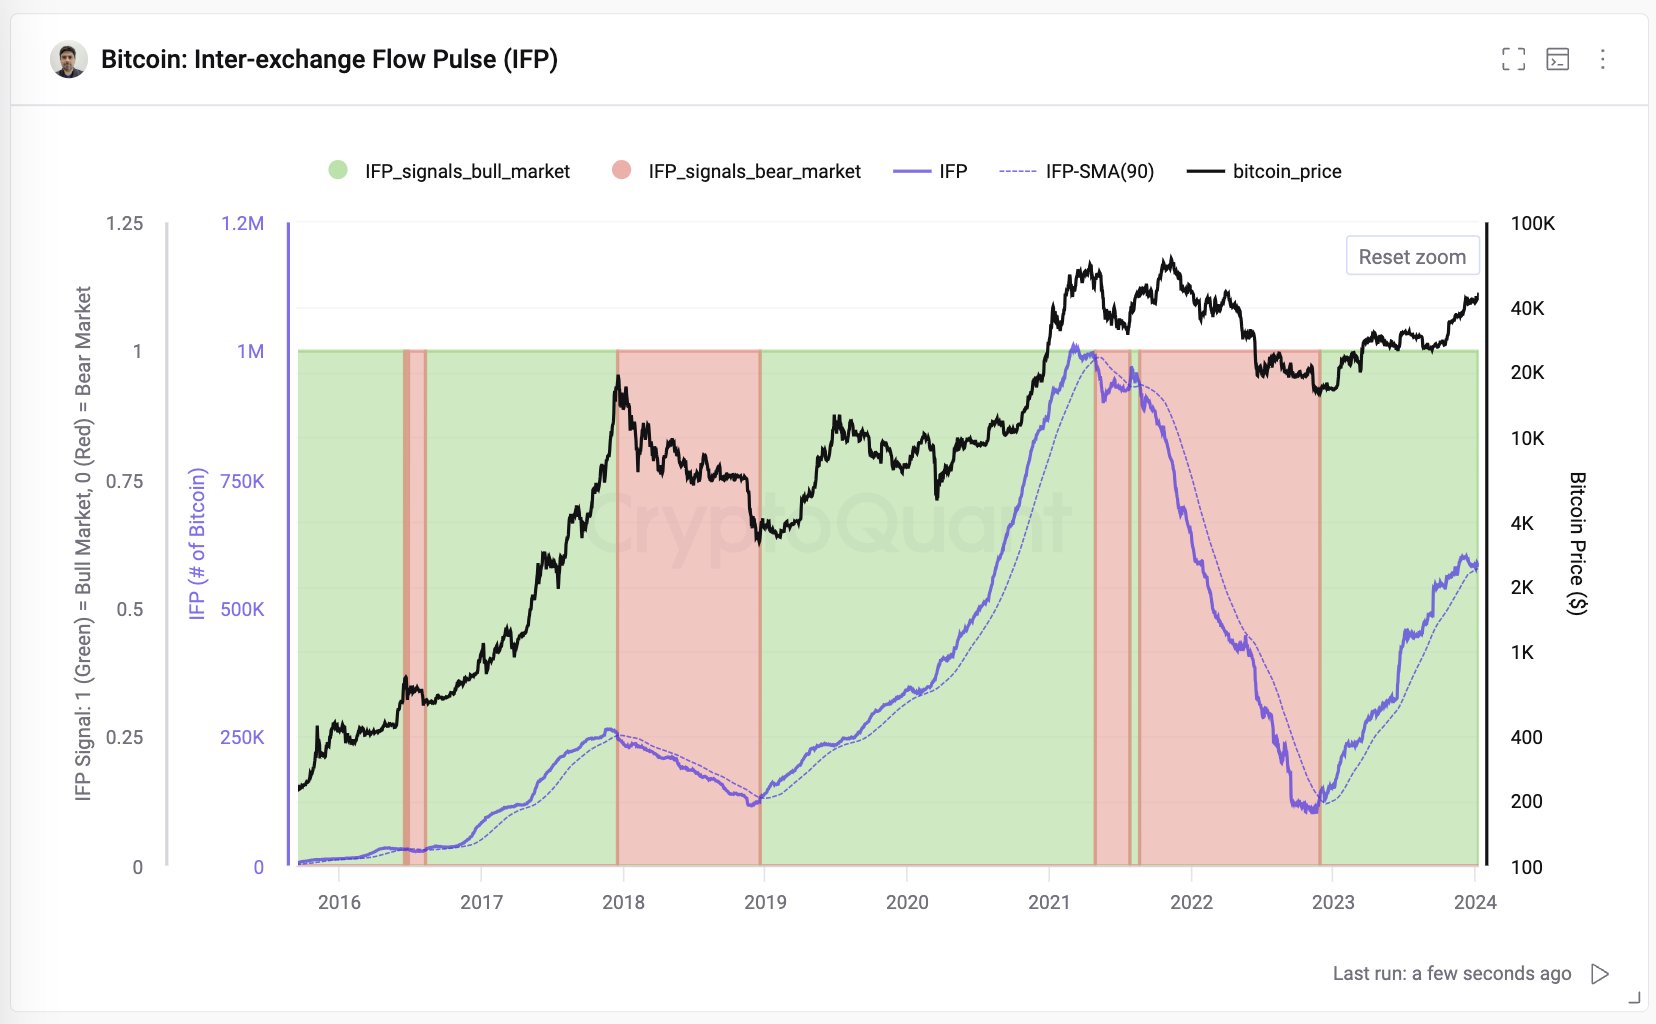
Now, here is a chart that shows the pattern that the Bitcoin IFP has followed over the past few years:
As displayed in the above graph, the Bitcoin IFP followed a near-constant downtrend between mid-2021 and the end of 2022. This pattern suggested that the large investors were constantly lowering their risk, as the market had transitioned into a bearish one.
Following the FTX collapse, the indicator finally started to turn itself around as risk appetite made a comeback for the whales. The metric then displayed a rise during the entirety of 2023, as these humongous entities ramped up their flows towards derivative platforms, aiming to get their positions up.
Recently, however, the metric has been displaying the early signs of another turnaround, as it has started heading down instead. The 90-day simple moving average (SMA) is what the analytics firm uses for defining the boundary across which wider transitions in trend take place.
Breaks above the line have signaled bull markets (highlighted in green in the chart), while crosses below have suggested bearish trends (the red periods). From the graph, it’s apparent that the Bitcoin IFP is currently retesting this line of historical significance.
A complete cross below may not necessarily imply an extended switch towards a bearish trend (as was the case in 2016, where the bearish price action only took grip temporarily before the metric reversed back up). But it would certainly suggest at least a local top for Bitcoin if history is to go by.
BTC Price
Bitcoin has enjoyed some sharp growth over the past day as ETF anticipation grows in the market, with the price currently trading around $46,700.
