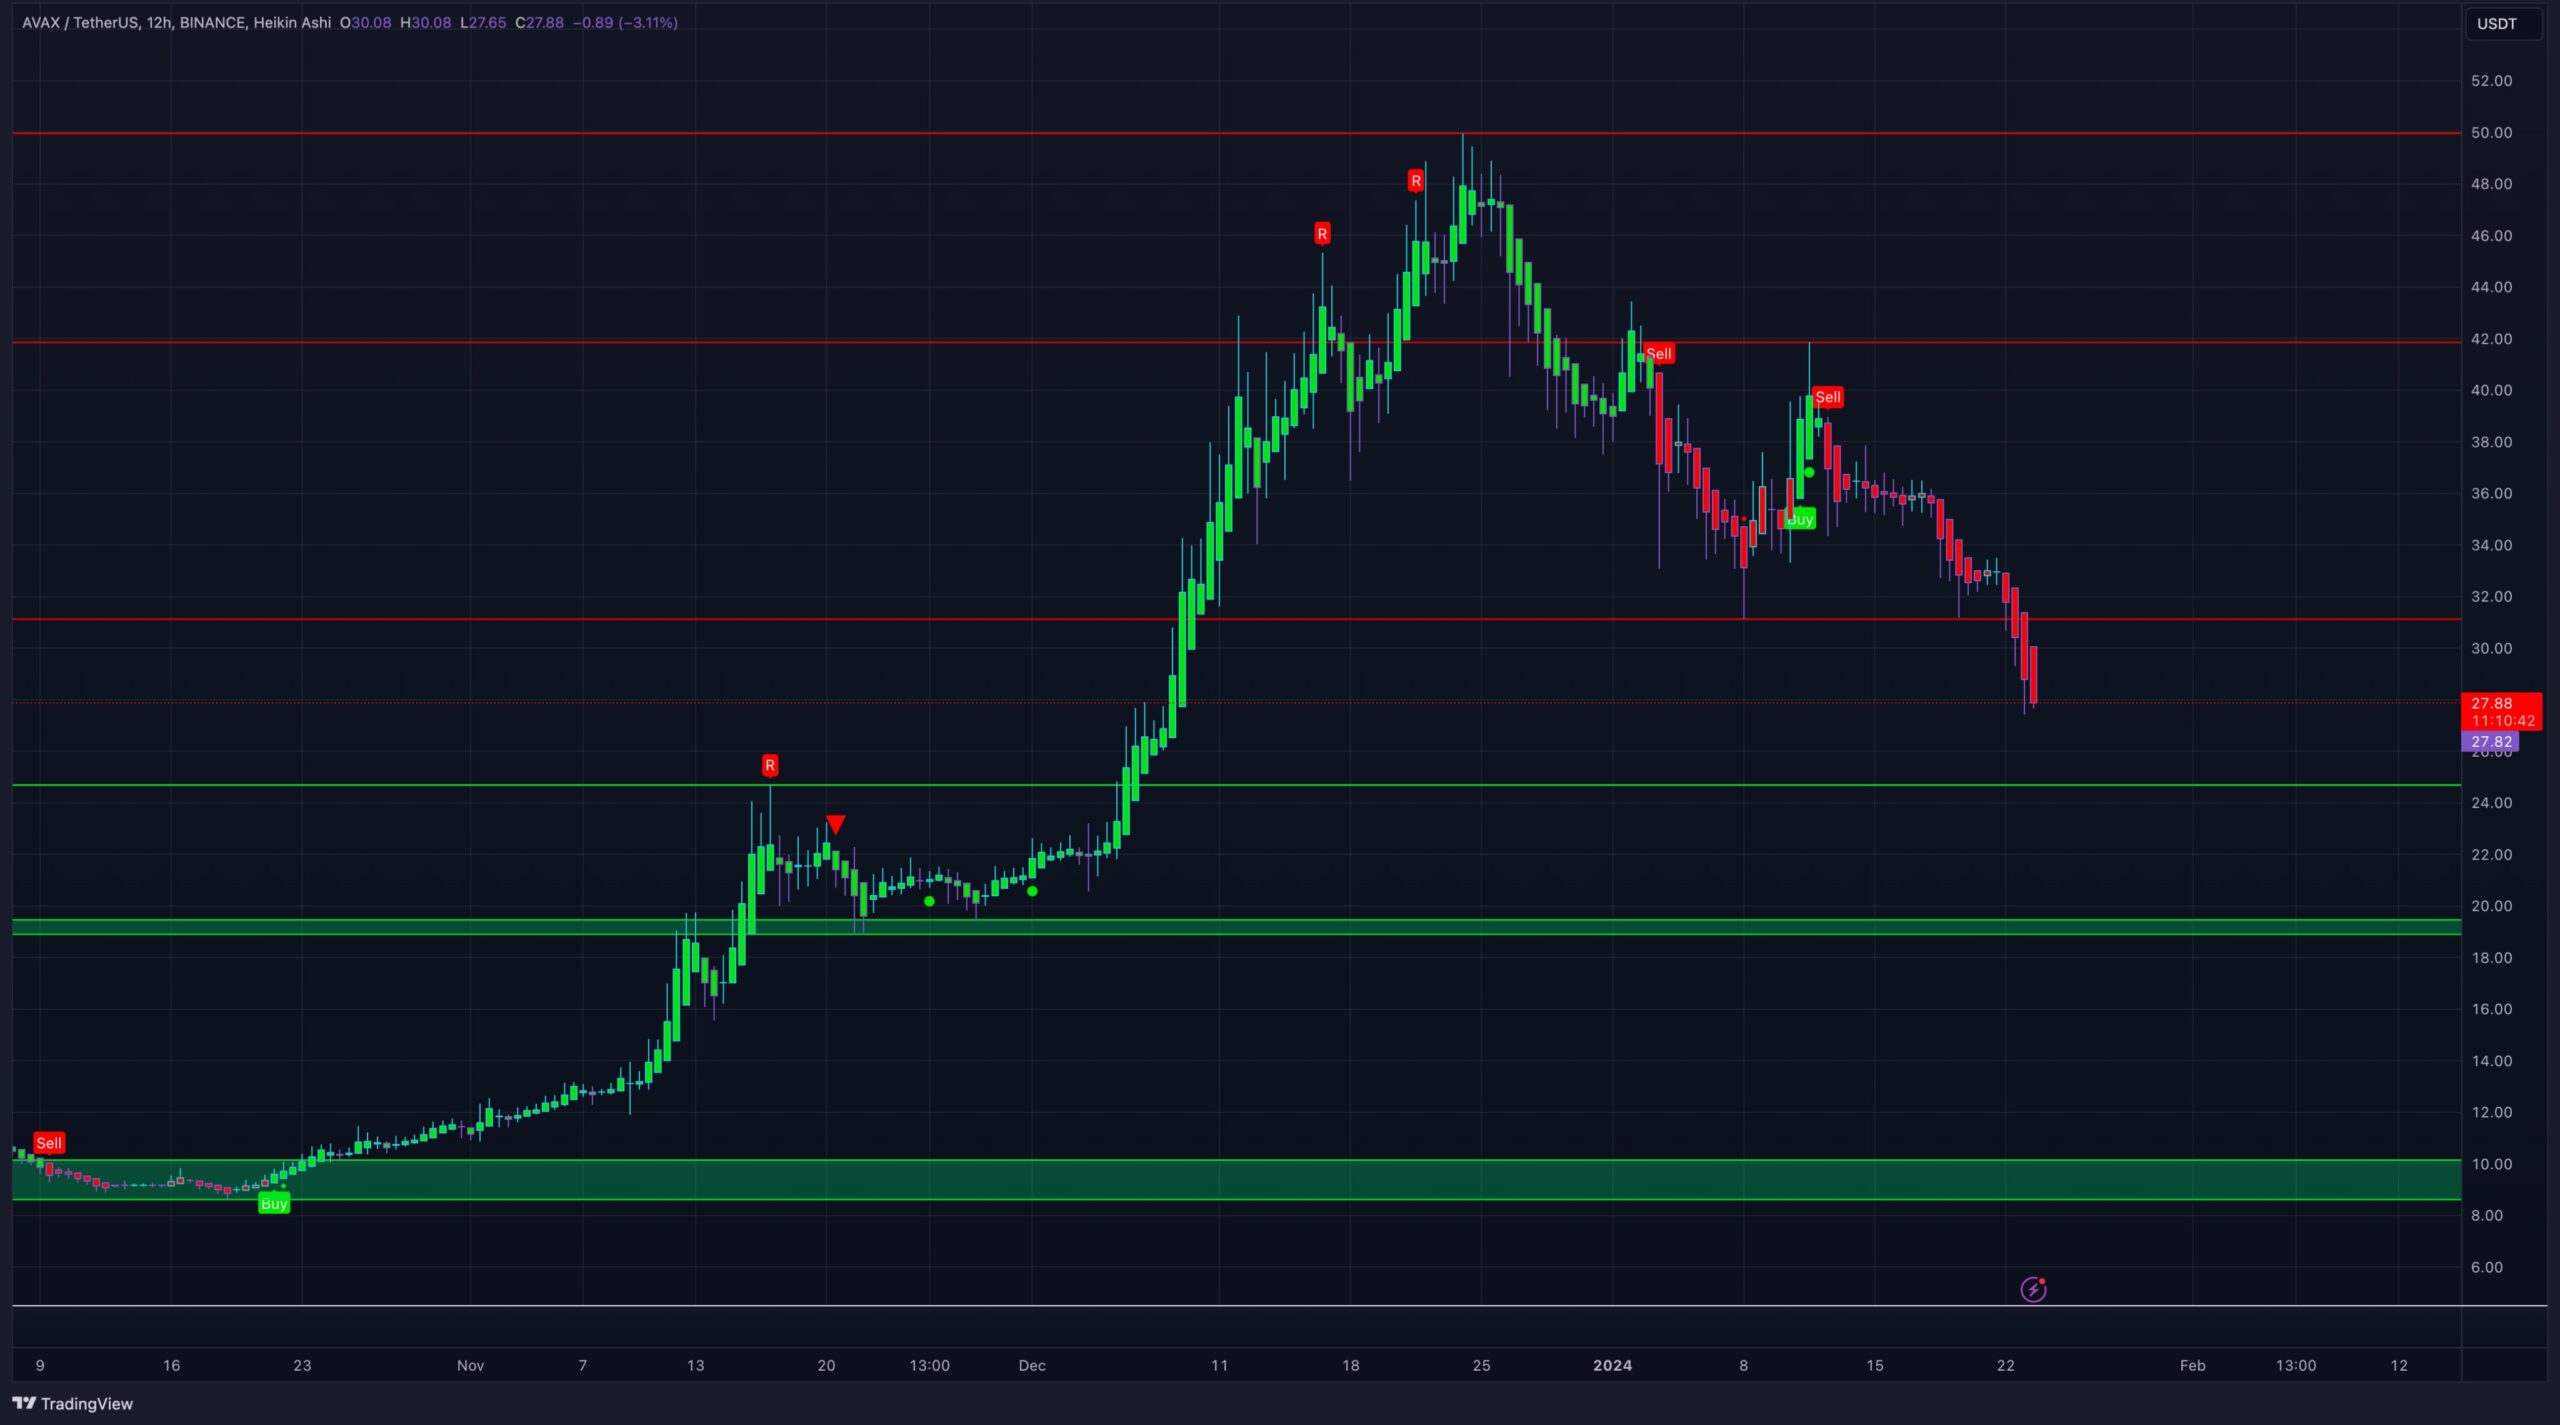
The Avalanche (AVAX) price has fallen by nearly 40% since its 2023 high of $50 on December 24.
Despite the bearish trend, AVAX trades in a corrective pattern and bounced sharply yesterday.
Avalanche Falls After Yearly High
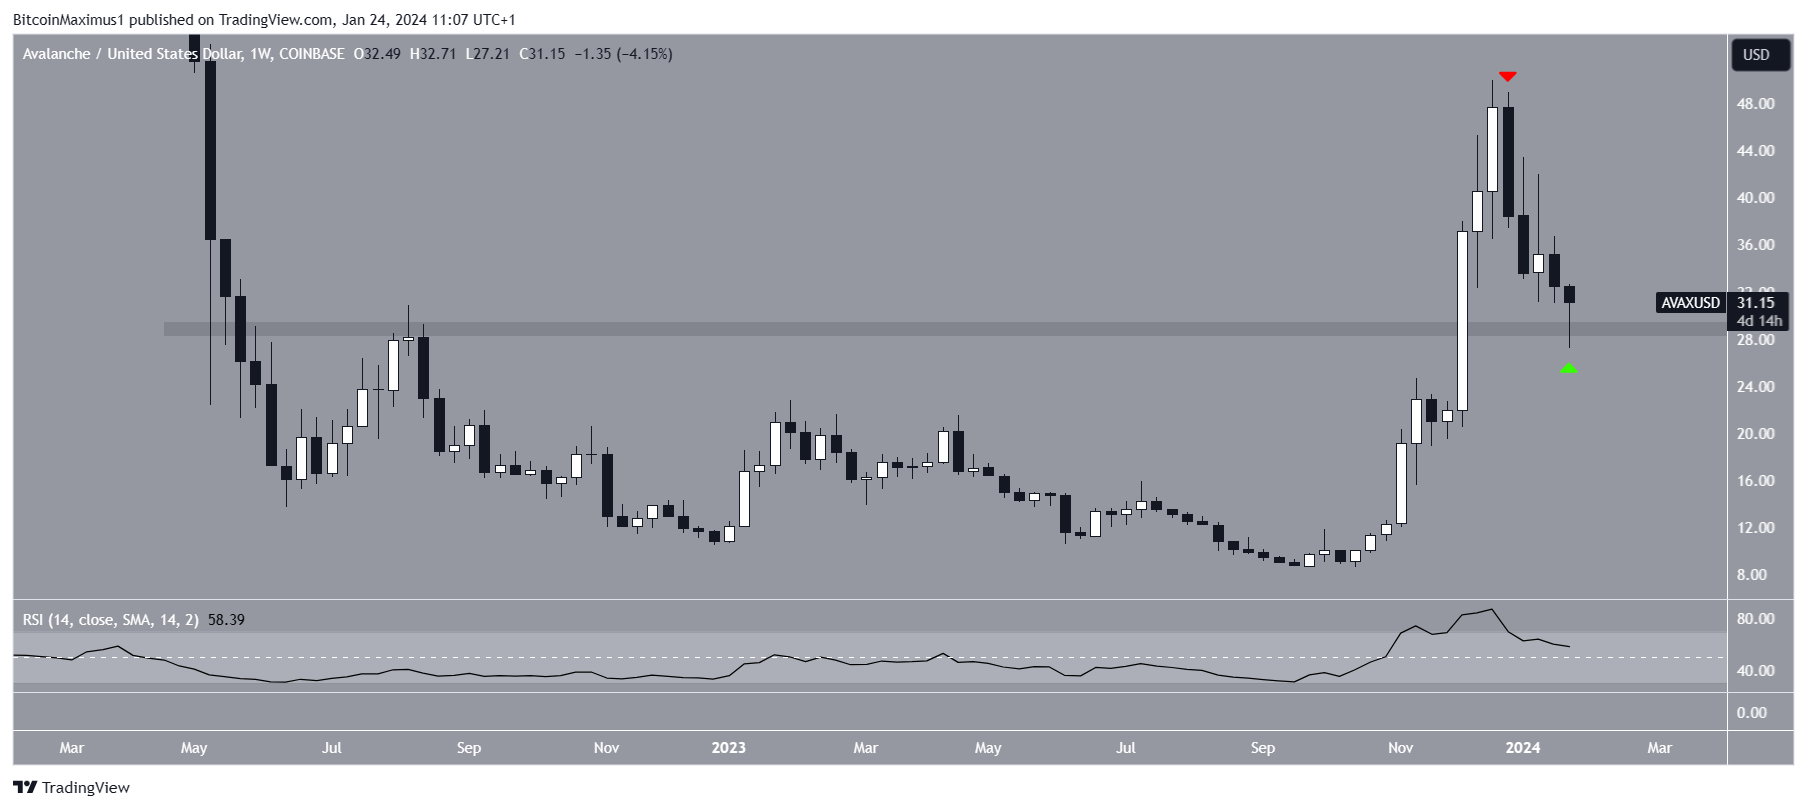
The technical analysis of the weekly time frame shows that the AVAX price has fallen since reaching a high of $50 in December 2023. The decrease has been swift, with the price creating a bearish engulfing candlestick the next week (red icon).
Yesterday, AVAX fell to a low of $27.21 and bounced. The bounce validated a long-term horizontal area from which the price previously broke out. AVAX is in the process of creating a long lower wick (green icon).
The weekly Relative Strength Index (RSI) gives an undetermined reading.
When evaluating market conditions, traders use the RSI as a momentum indicator to determine whether a market is overbought or oversold and whether to accumulate or sell an asset.
If the RSI reading is above 50 and the trend is upward, bulls still have an advantage, but if the reading is below 50, the opposite is true. The RSI is falling but above 50, a sign of an undetermined trend.
Read More: How to Buy Avalanche (AVAX)?
What Are Analysts Saying?
Cryptocurrency traders and analysts on X have a bullish view of the future trend. MTI Trading believes that AVAX has nearly reached its bottom. He tweeted:
$AVAX is already 45% down. A little bit more and you have a good entry for the bull run. If you want to be more safe just wait for the next buy signal!

Wolf Of Altcoins suggests that AVAX will be one of the cryptocurrencies that increases 10x this bull run, while TOP GAINER TODAY stated that AVAX will go to $50 or even $100.
Read More: What is Avalanche (AVAX)?
AVAX Price Prediction: Is the Bottom Close?
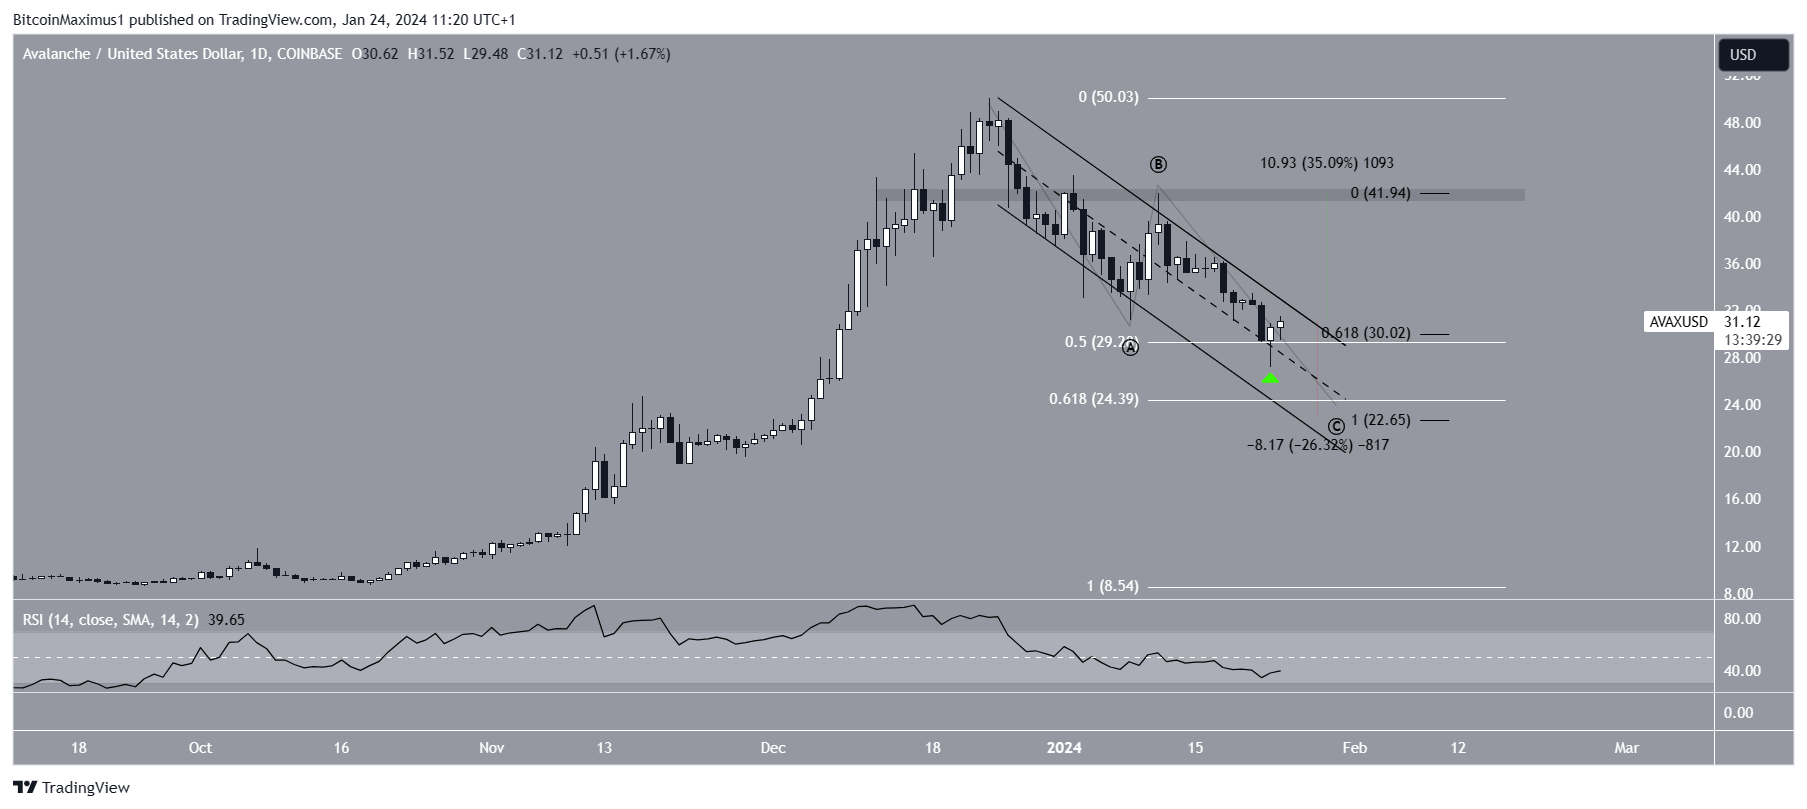
The technical analysis of the daily time frame does not confirm the trend’s direction. However, it suggests that AVAX will reach a bottom soon.
Since the December 2023 high, AVAX has fallen inside a descending parallel channel. Such channels often contain corrective movements.
Yesterday, AVAX bounced at the channel’s midline (green icon) and the 0.5 Fib retracement support level.
The wave count also supports the creation of a bottom. Technical analysts employ the Elliott Wave theory as a means to identify recurring long-term price patterns and investor psychology, which helps them determine the direction of a trend.
The most likely wave count suggests that AVAX is in the C wave of an A-B-C corrective structure. So far, waves A:C have a 1:0.618 ratio. However, the daily RSI does not confirm the bottom since the indicator is below 50.
If AVAX breaks out from the channel, it can increase 35% to the closest resistance at $42.

Despite the bullish AVAX price prediction, falling below yesterday’s low of $27.22 will mean the price is still correcting. Then, AVAX can fall 26% to the channel’s support trend line at $22.65. This will give waves A:C a 1:1 ratio.
For BeInCrypto‘s latest crypto market analysis, click here.
![]()
GT Protocol
GT Protocol” target=”_blank”>Explore →
![]()
DeGate
DeGate” target=”_blank”>Explore →
![]()
KuCoin
KuCoin” target=”_blank”>Explore →
![]()
Metamask Portfolio
Metamask Portfolio” target=”_blank”>Explore →
![]()
Wirex App
Wirex App” target=”_blank”>Explore →
Explore more
The post Avalanche (AVAX) Price Bounces Back Above $30 – Has it Reached a Bottom? appeared first on BeInCrypto.
