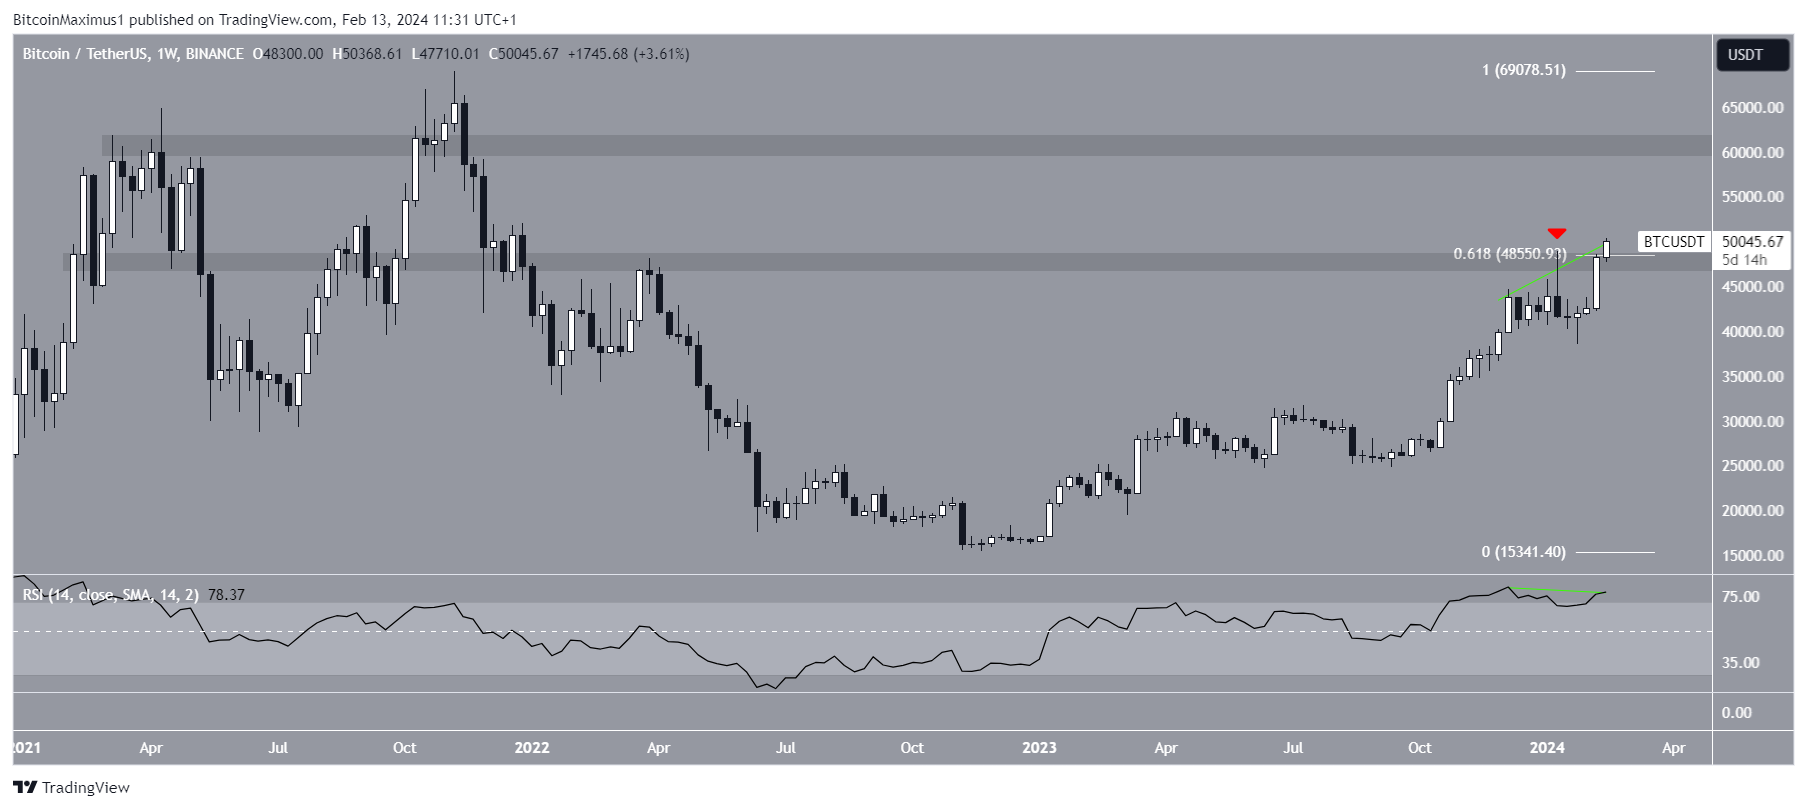
Today, Bitcoin’s (BTC) price reached a new yearly high above $50,000. This is the highest price since December 2021.
The upward movement took Bitcoin above a long-term horizontal and Fib retracement resistance level.
Bitcoin Negates Bearish Candlestick
Bitcoin’s price has increased at an accelerated rate since October 2023. Initially, the upward movement led to a high of $48,969 in January 2024. The ensuing decrease created a bearish candlestick (red icon) and validated a long-term horizontal and Fib retracement resistance level.
While the rejection catalyzed a nearly month-long downward movement, BTC regained its footing in the past three weeks and reached a new yearly high of $50,368 today. The high was made above the horizontal and Fib resistance level mentioned before. The importance of this resistance cannot be overstated since it is the final one before the all-time high region.
The weekly Relative Strength Index (RSI) gives conflicting readings. Traders utilize the RSI as a momentum indicator to assess whether a market is overbought or oversold and whether to accumulate or sell an asset.
If the RSI reading is above 50 and the trend is upward, bulls still have an advantage, but if the reading is below 50, the opposite is true. While the RSI is above 70 and increasing, a potential bearish divergence is developing, depending on the weekly close.
Read More: Where To Trade Bitcoin Futures
What Are Analysts Saying?
Cryptocurrency traders and analysts on X positively view the future BTC trend.
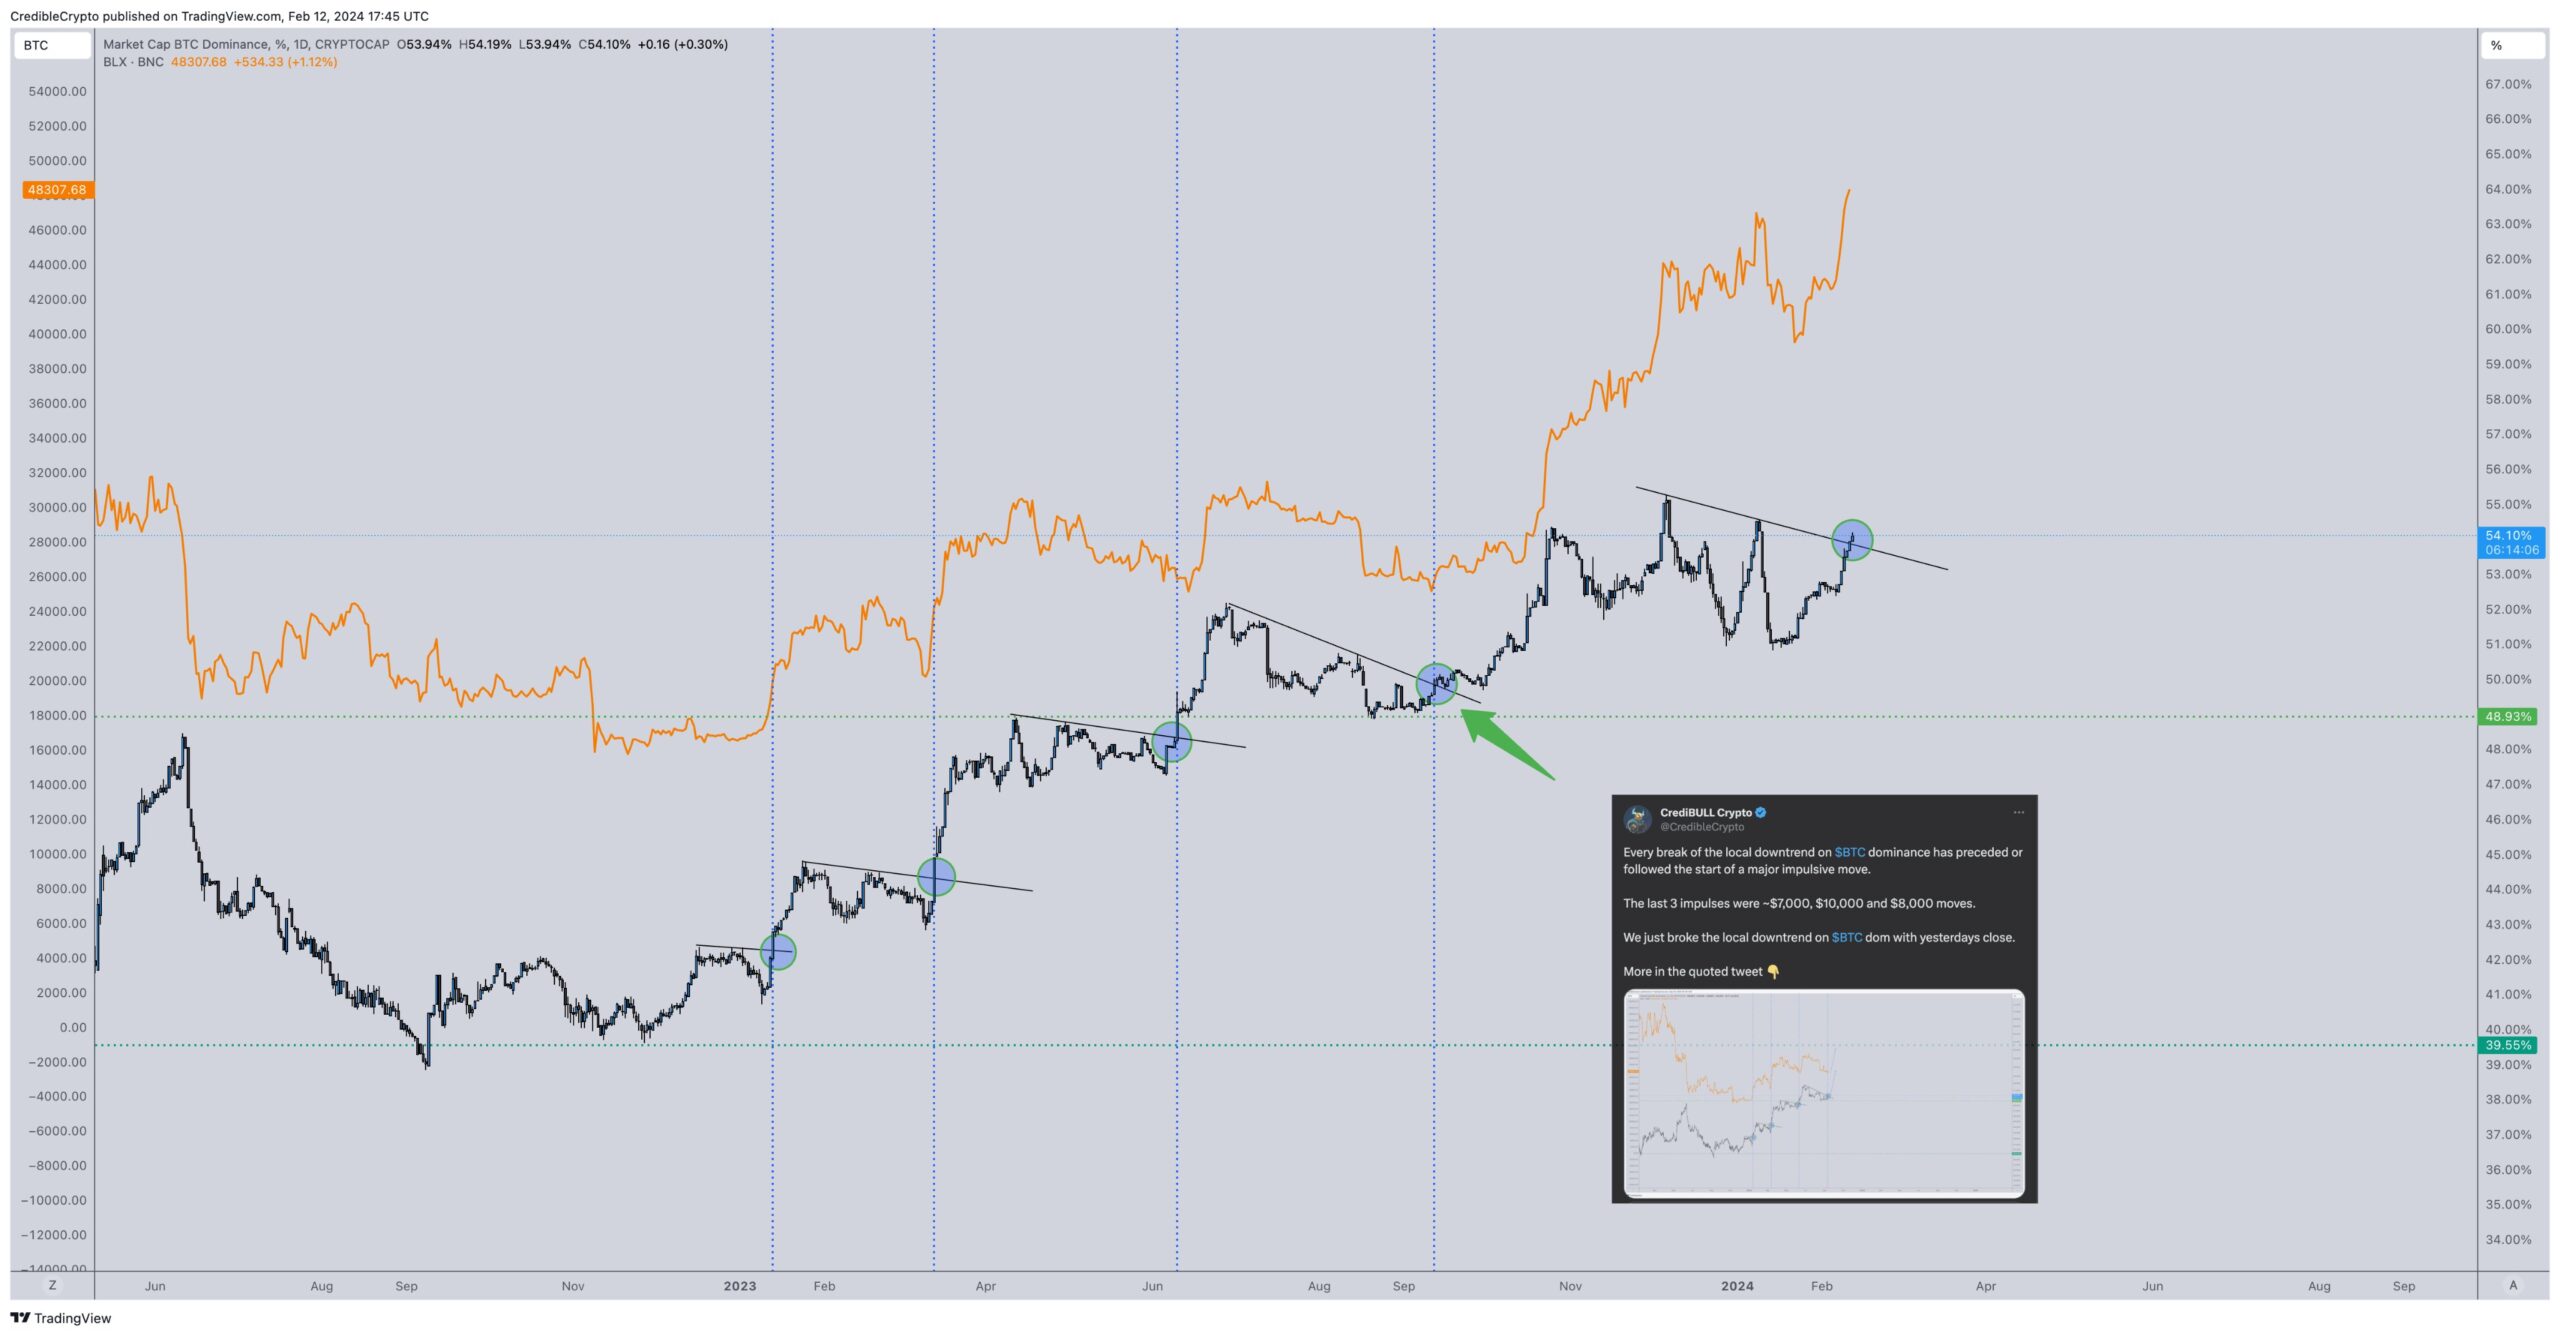
CredibleCrypto noted the BTC Dominance Rate (BTCD) breakout has previously preceded sharp increases in the BTC price. They also noted that BTCD is in the process of breaking out.
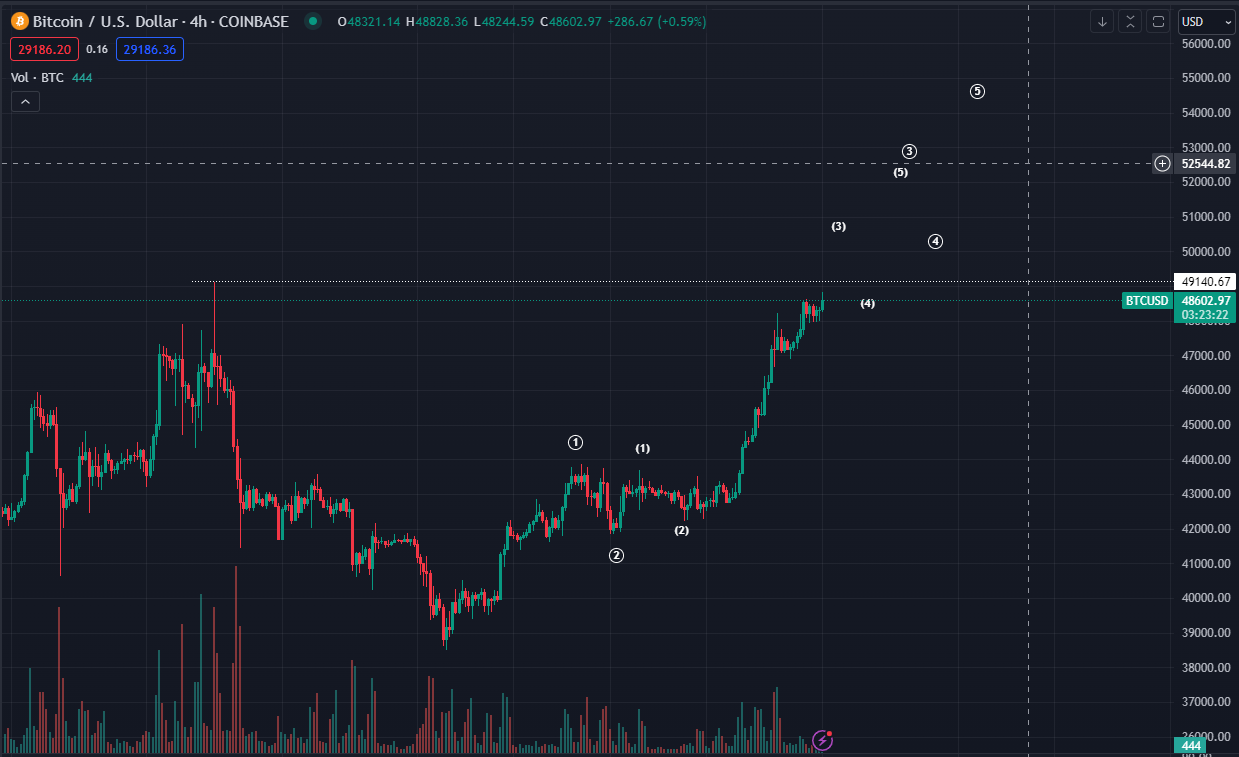
TechDev_52 uses Elliott Wave theory to predict the price will increase to $130,000.
Technical analysts employ the Elliott Wave theory to identify recurring long-term price patterns and investor psychology, which helps them determine the direction of a trend.
Bluntz_Capital gives a similar outlook, though he uses a short-term count to predict the future movement.
Finally, InmortalCrypto noted that the BTC price will rally significantly after the halving in April, as it has done in the previous bull cycles.
Matteo Greco, research analyst at Fineqia International, believes that the inflows into the spot Bitcoin ETFs are the primary driver of this growth.
“The primary driver behind this price appreciation can be attributed to the increased inflow into BTC Spot ETFs. In the past week, total outflows from GBTC amounted to approximately $415 million, translating to a daily average of about $83 million. This represents nearly an 85% reduction in outflows compared to the first two weeks of trading” Greco stated.
Furthermore, Mr. Greco said that there is a correlation between the reduced outflow from the Grayscale Bitcoin Trust (GBTC) and the increase in inflows of the Bitcoin spot ETFs. He noted that the influx into BTC spot ETFs started on January 26, aligning with the reduction of outflows from GBTC.
Read More: Who Owns the Most Bitcoin in 2024?
BTC Price Prediction: Will February be Bullish?
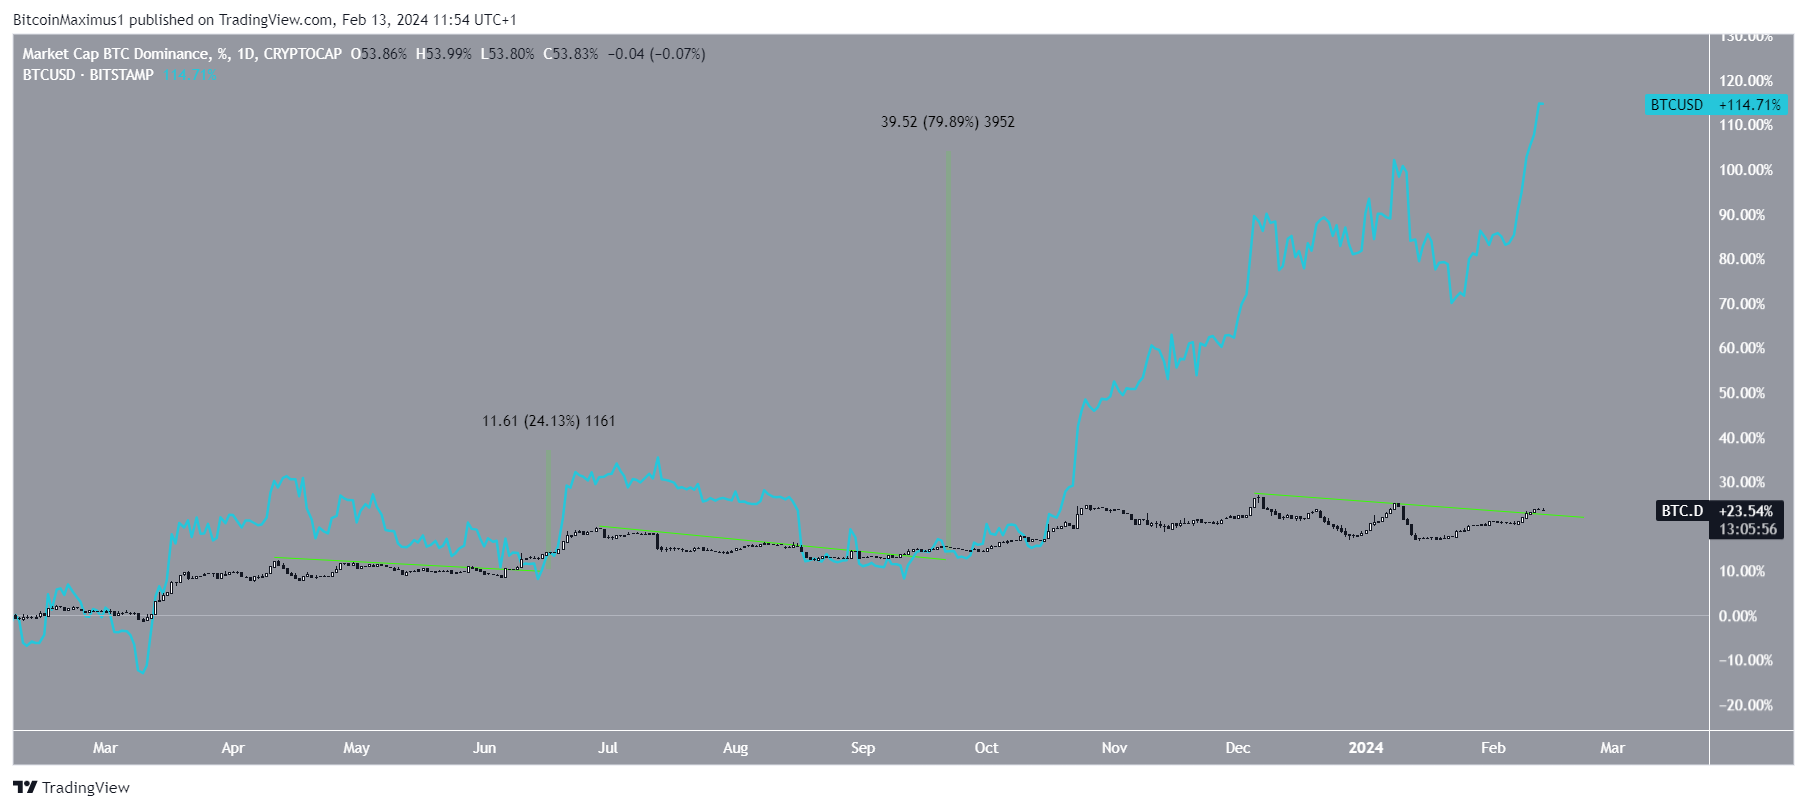
The correlation between BTCD breakouts and the BTC price is very interesting. Since the start of 2023, there have been three BTCD breakouts (green trend lines), including the current one.
The two previous breakouts led to 25% and 80% increases, respectively.
Both times, the BTC price took some time until it exceeded its previous high. However, it has already done so in the current movement. This could signify that the ensuing upward movement will be sharper than the preceding ones.
Read More: What is a Bitcoin ETF?
Returning to the weekly time frame, a range between $30,000 and $60,000 can be drawn, where BTC has traded for most of the past three years.
Last week’s increase took the price above the midrange (white) of $46,000. This is a sign often followed by an increase toward the range high, which in Bitcoin’s case is at $60,000, 20% above the current price, well in line with previous BTCD breakouts.
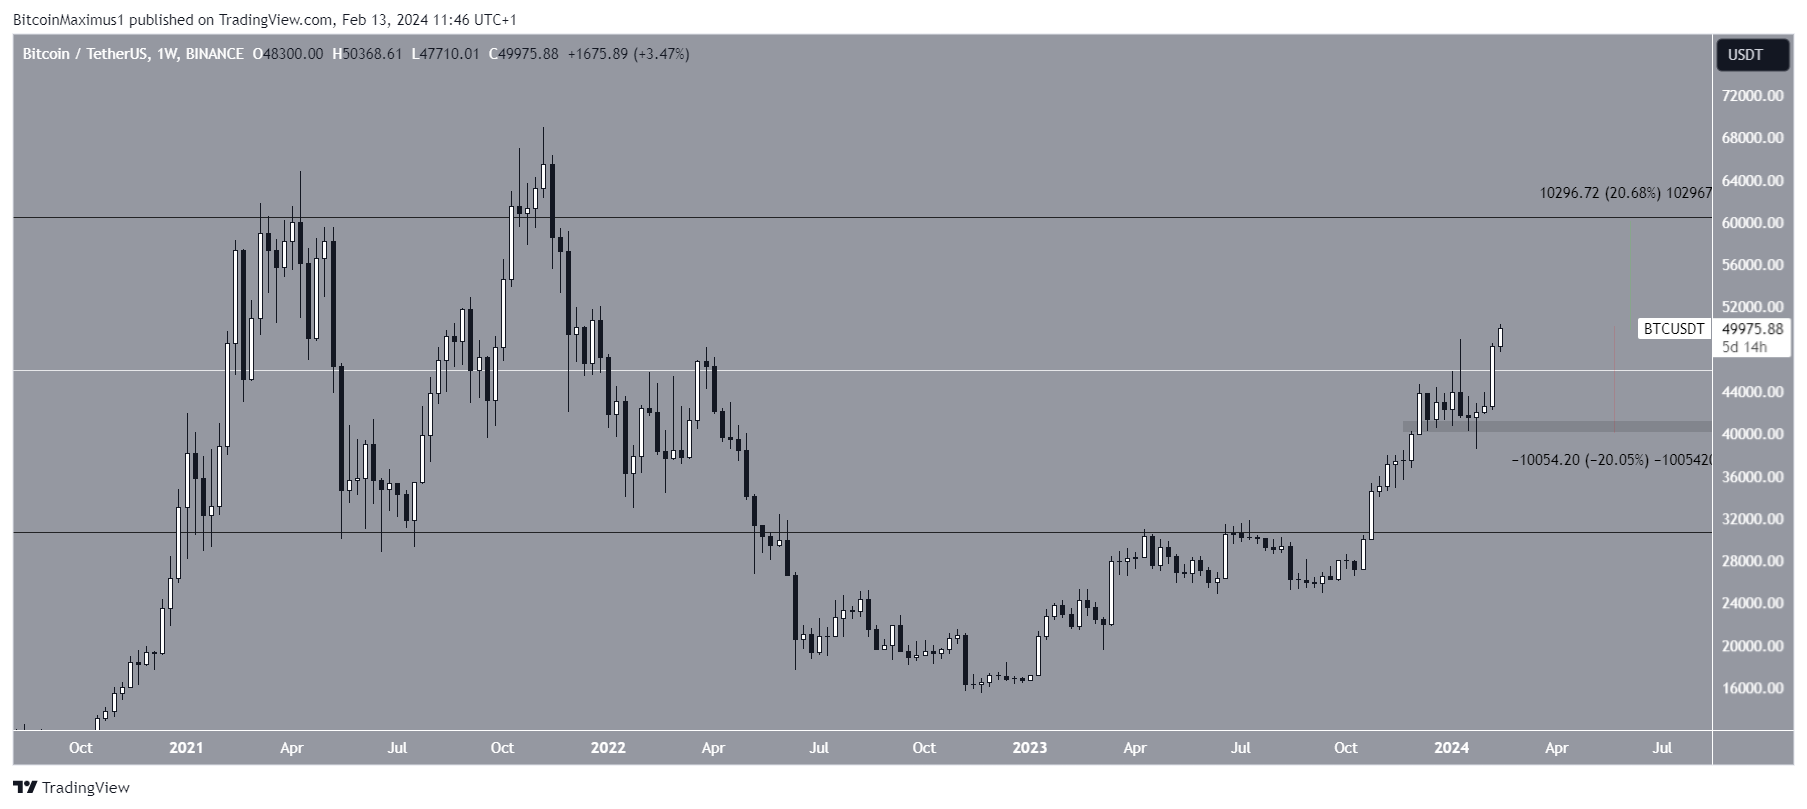
Despite this bullish BTC price prediction, a weekly close below $46,000 will invalidate the breakout. Then, the price can fall 20% to the closest support at $40,500.
For BeInCrypto‘s latest crypto market analysis, click here.
![]()
PrimeXTB
PrimeXTB ” target=”_blank”>Explore →
![]()
Wirex App
Wirex App” target=”_blank”>Explore →
![]()
AlgosOne
AlgosOne” target=”_blank”>Explore →
![]()
YouHodler
YouHodler” target=”_blank”>Explore →
![]()
KuCoin
KuCoin” target=”_blank”>Explore →
![]()
Margex
Margex” target=”_blank”>Explore →
Explore more
The post Bitcoin (BTC) Price Spikes Over $50,000: What’s Fueling the Increase? appeared first on BeInCrypto.
