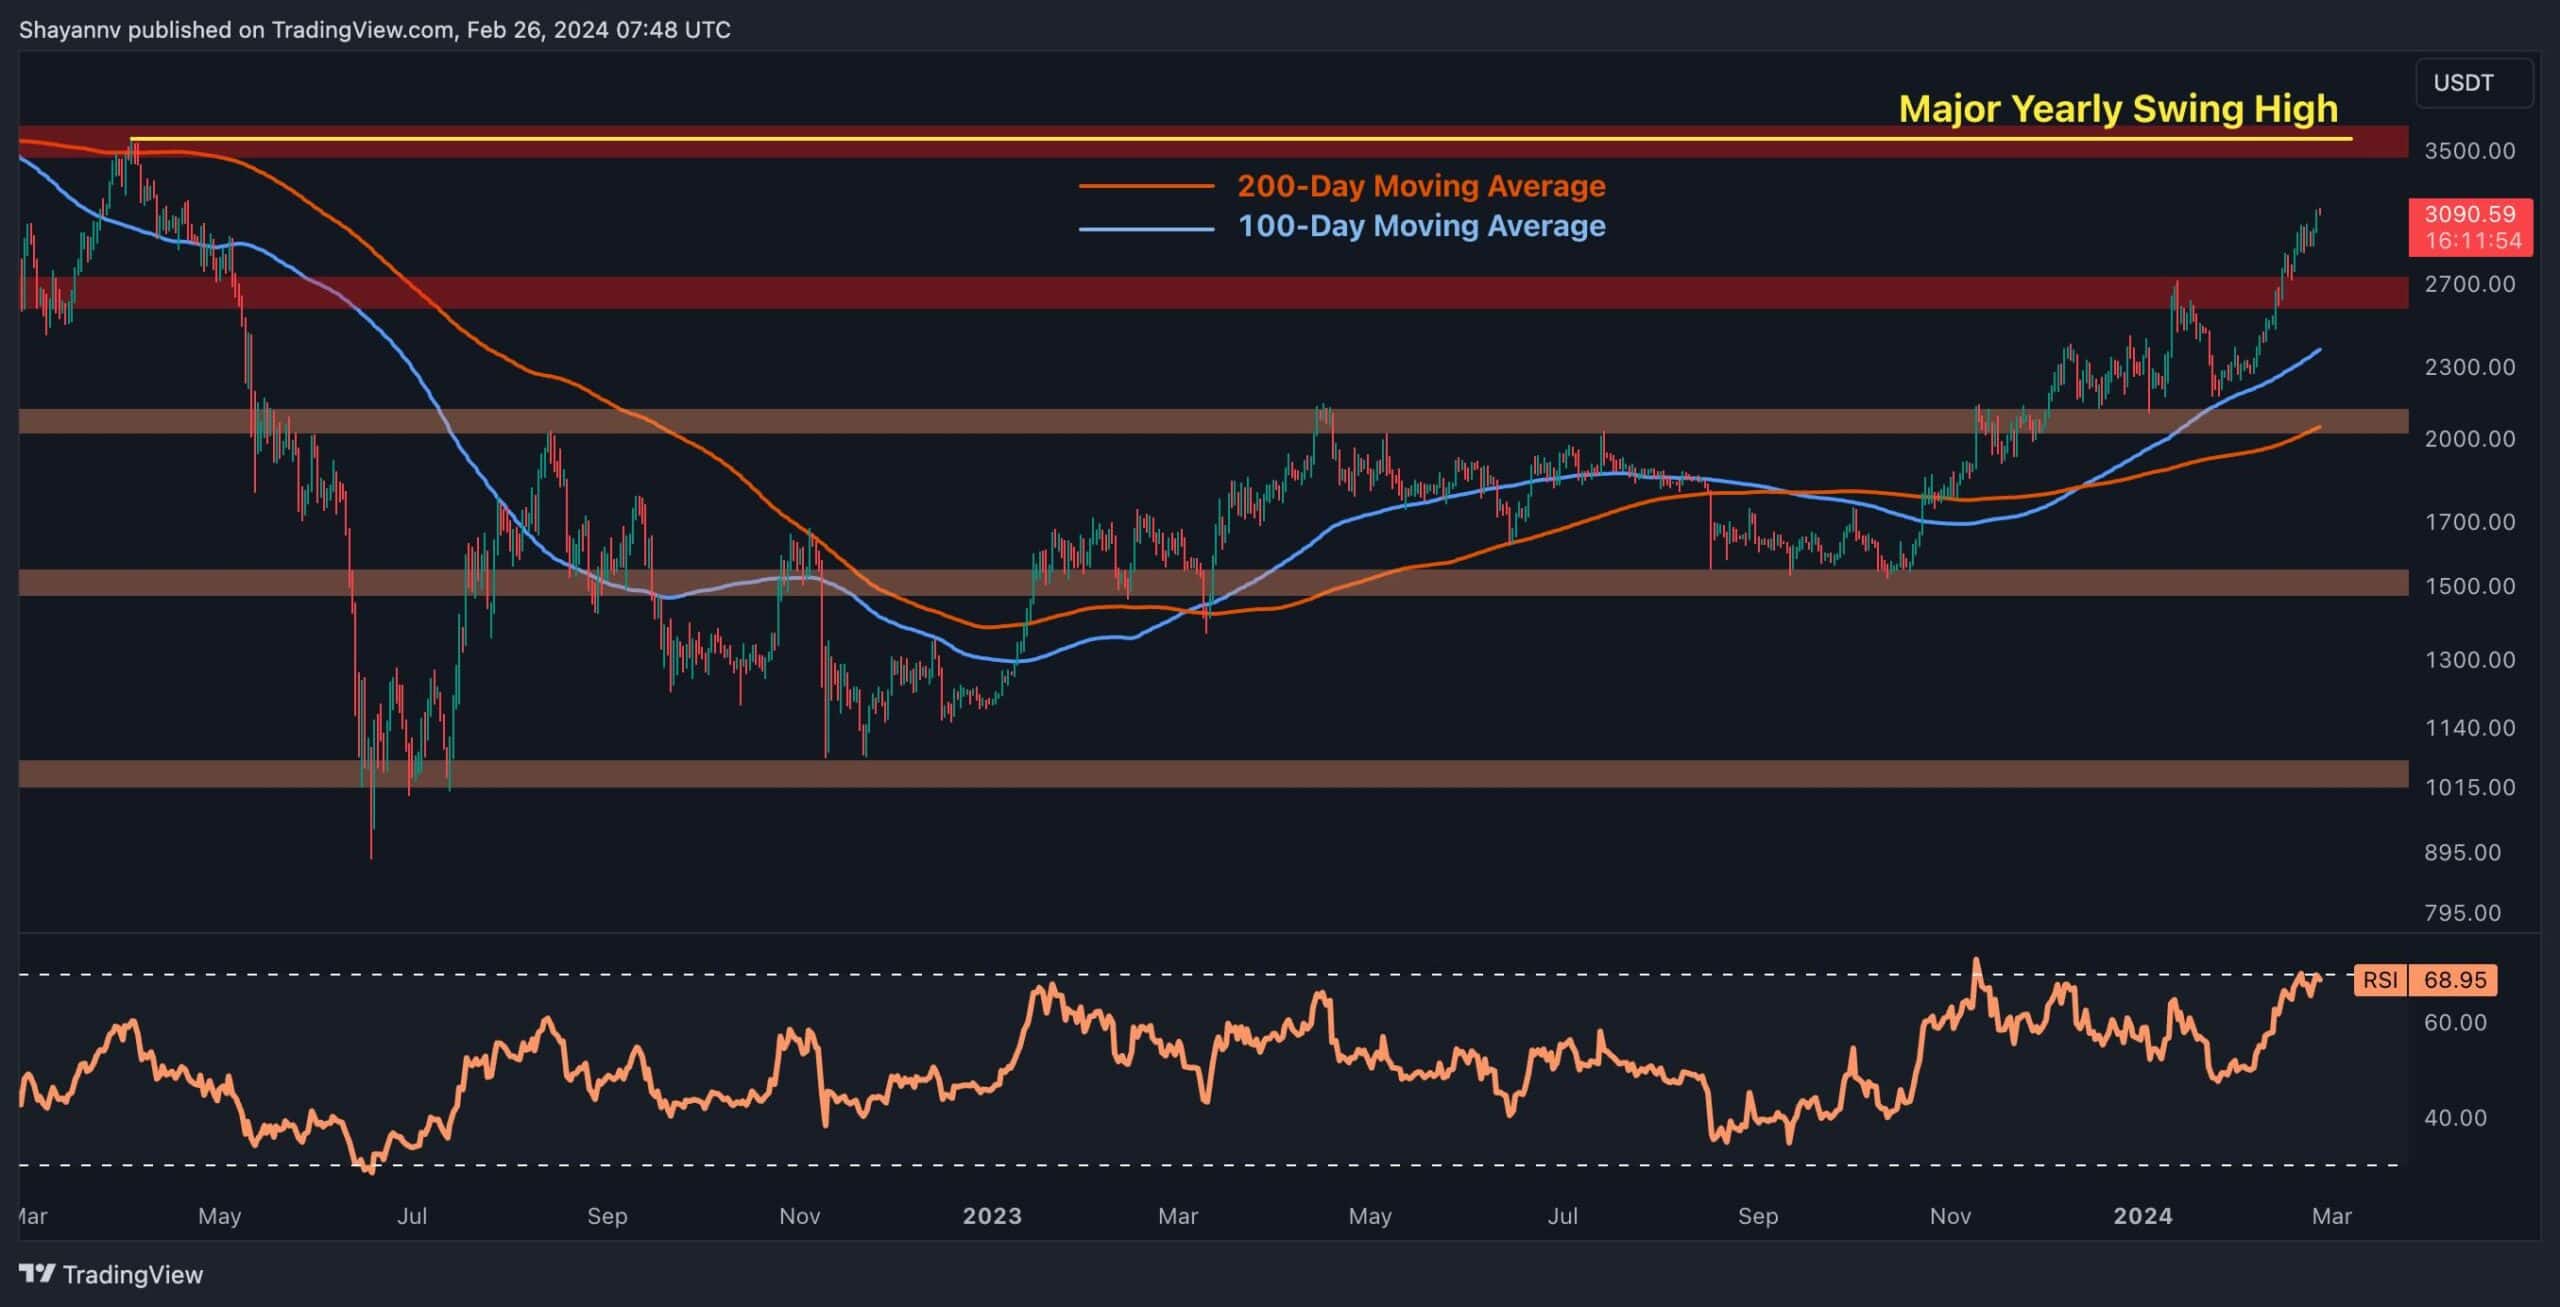
Ethereum has recently experienced a notable upswing, surging past key resistance levels, including the $2.8K mark, and breaching the significant psychological barrier of $3K.
This upward movement suggests a prevailing bullish sentiment in the market, with investors eyeing the crucial yearly swing high of $3.6K as the next target.
By Shayan
The Daily Chart
A closer look at the daily chart reveals Ethereum’s impressive rally following a bounce off the 100-day moving average, confirming its strength as it reclaims the $2.8K resistance zone. The recent price action indicates a strong bullish sentiment, with expectations mounting for Ethereum to reach a new all-time high (ATH) in 2024.
Despite the optimism, there’s a cautious note regarding a potential expanded bearish divergence between the price and the RSI indicator.
This suggests a likelihood of short to mid-term correction or consolidation before Ethereum makes its next significant move. For now, the price range between $2.8K and $3.6K is likely to contain Ethereum’s movements until a breakout occurs.
The 4-Hour Chart
Examining the 4-hour chart, a compelling bullish reversal can be witnessed near the multi-month ascending trendline, propelling Ethereum to its highest level since April 2022.
This surge, coupled with a successful pullback above the crucial prior swing high, indicates strong buying interest with the aim of propelling Ethereum toward the significant resistance region of $3.6K. Nevertheless, considering the recent price action and the market sentiment, the prevailing bullish trend seems more likely to remain sustainable.
However, despite the noteworthy bullish momentum, periodic downward corrections are expected amid the prevailing trend. Key support levels to watch include:
- The $2.8K region
- The $2.5K region
- The $2.1K region
- The dynamic ascending trendline
While short to mid-term corrections may introduce volatility, the overall outlook remains optimistic, with Ethereum poised for further gains.
By Shayan
Ethereum has seen a robust uptrend in recent weeks, fueling optimism among investors who anticipate a retest of its all-time high. This chart illustrates Ethereum’s funding rates, reflecting the aggressiveness of market orders executed by buyers and sellers. Positive values signal bullish sentiment, while negative values suggest bearish expectations among futures traders.
Following a consolidation correction in price action accompanied by a decline in funding rates, both metrics have surged notably. This trend, if sustained, indicates a prolonged bullish trajectory for Ethereum.
However, while rising funding rates align with the bullish market, excessively high values can pose challenges. Elevated rates increase the likelihood of long liquidation cascades, potentially leading to sharp price declines. Thus, careful monitoring of funding rates is crucial amidst Ethereum’s bullish momentum.
Binance Free $100 (Exclusive): Use this link to register and receive $100 free and 10% off fees on Binance Futures first month (terms).
Disclaimer: Information found on CryptoPotato is those of writers quoted. It does not represent the opinions of CryptoPotato on whether to buy, sell, or hold any investments. You are advised to conduct your own research before making any investment decisions. Use provided information at your own risk. See Disclaimer for more information.
Cryptocurrency charts by TradingView.
