Assessing the correlation between Bitcoin and macroeconomic data is a key step in identifying long-term trends. A recent analysis suggests that monitoring central bank balance sheets can provide deeper insights instead of focusing solely on global M2 money supply.
However, the macro picture is more complex than charts may suggest. The following analysis highlights intertwined factors from expert perspectives.
What Does the Correlation Between Global Central Bank Liquidity and Bitcoin Price Indicate?
A recent study by Alphractal argues that central bank liquidity flows into the economy—stocks, gold, and crypto—much faster than global M2 supply.
Therefore, comparing central bank liquidity data with Bitcoin’s price reveals how the correlation works.
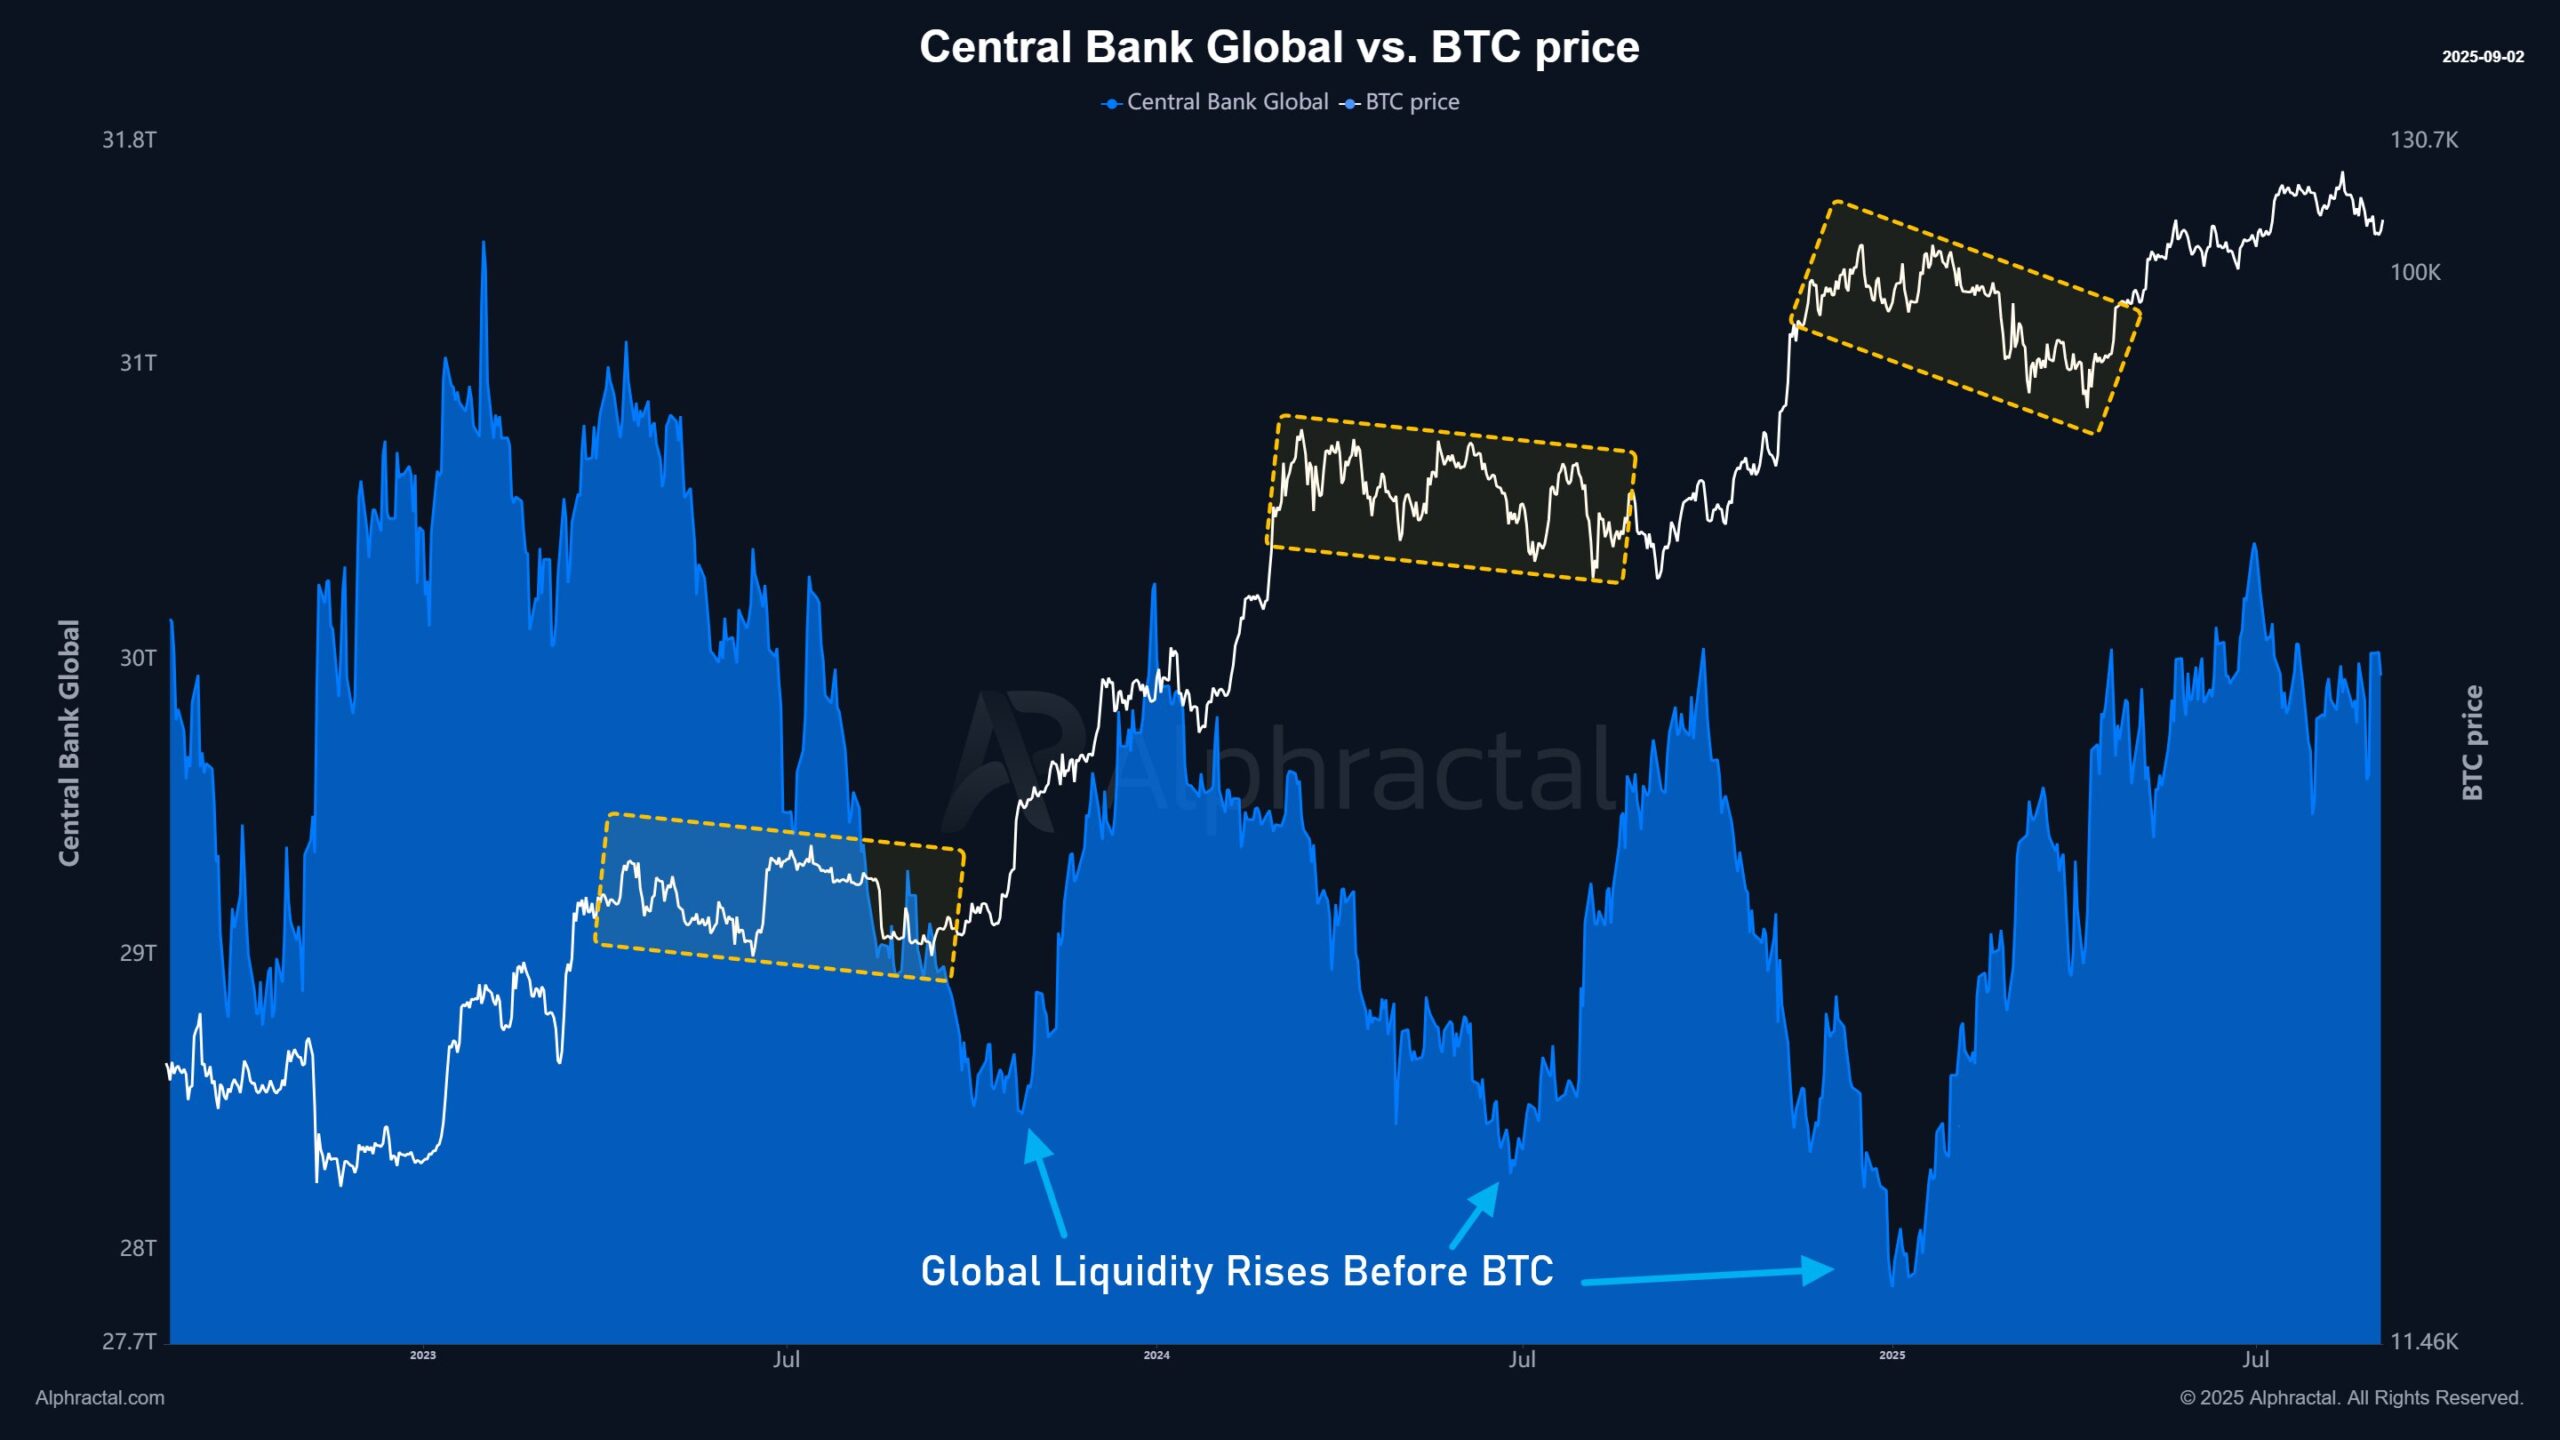
Data shows that global central bank liquidity fluctuated between $28 trillion and $31 trillion from 2023 to 2025, moving through four expansion-and-contraction cycles. Each time liquidity increased, Bitcoin rose about two months later.
“Global central bank liquidity tends to rise before BTC. Usually, when liquidity is in its final stage of decline, BTC enters a period of sideways movement. In other words, central banks inject money first, and part of that liquidity later migrates into risk assets—like BTC,” Alphractal explained.
This observation helps explain Bitcoin’s fluctuations between $100,000 and $120,000 in Q3, as liquidity has stabilized below $30 trillion.
Zooming out the chart since 2020, analyst Quinten noted that Bitcoin’s four-year cycle aligns closely with the four-year liquidity cycle.
These findings reinforce the critical role of central bank liquidity injections in shaping asset performance, including Bitcoin. They also suggest the possibility of a new liquidity cycle emerging in the next four years.
US Debt Growth Outpacing Liquidity Signals
Jamie Coutts, Chief Crypto Analyst at Realvision, added another layer to the discussion. Financial stress could emerge if debt continues to rise faster than liquidity, making markets more fragile.
He described global liquidity as a constantly refinancing machine in which debt expands faster than economic growth. Liquidity must keep pace to avoid collapse.
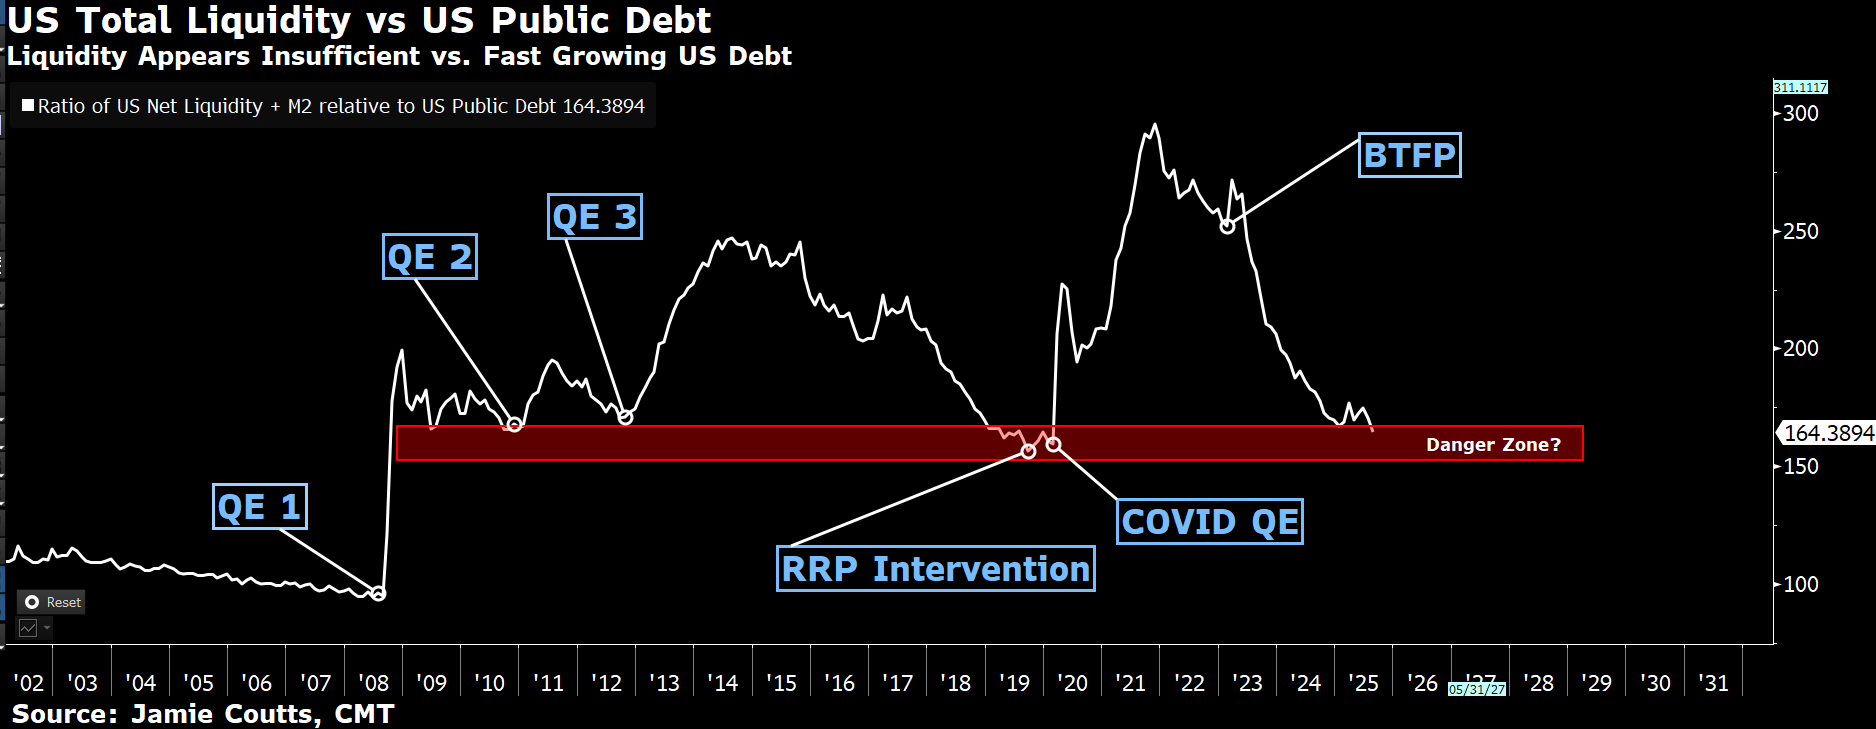
In the US, debt growth outpacing liquidity already signals systemic risk. His chart shows the ratio between liquidity and US debt has fallen to low levels.

“When the ratio is high, excess liquidity feeds inflation. When it’s low, funding pressures emerge and risk assets become vulnerable…So what? This doesn’t mean the cycle has ended. But it does signal fragility,” Jamie Coutts said.
Billionaire Ray Dalio also sees this fragility. He warned that the US public debt has reached dangerous levels and could trigger an “economic heart attack” within three years. He predicted that cryptocurrencies with limited supply may become attractive alternatives if the US dollar depreciates.
While Alphractal’s observations focus mainly on recurring historical patterns, Jamie Coutts and Ray Dalio emphasize present-day differences. Despite these contrasting views, Bitcoin remains in a unique position. Experts still argue that the impact of these forces could be positive for BTC.
The post Bitcoin and Central Bank Liquidity: The Hidden Correlation Driving Market Cycles appeared first on BeInCrypto.
