
Over the past few days, the Bitcoin market has witnessed largely unimpressive price action and performance. While the premier cryptocurrency did run up to as high as $108,000 earlier in the week, the BTC price was mostly constrained to a tight range between $103,000 and $106,000.
Indeed, the flagship cryptocurrency has maintained its position above the psychological $100,000 level since early May, but it has not exactly built on this momentum. The latest on-chain data has provided insight into Bitcoin’s current reluctance to move and its possible trajectory in the coming weeks.

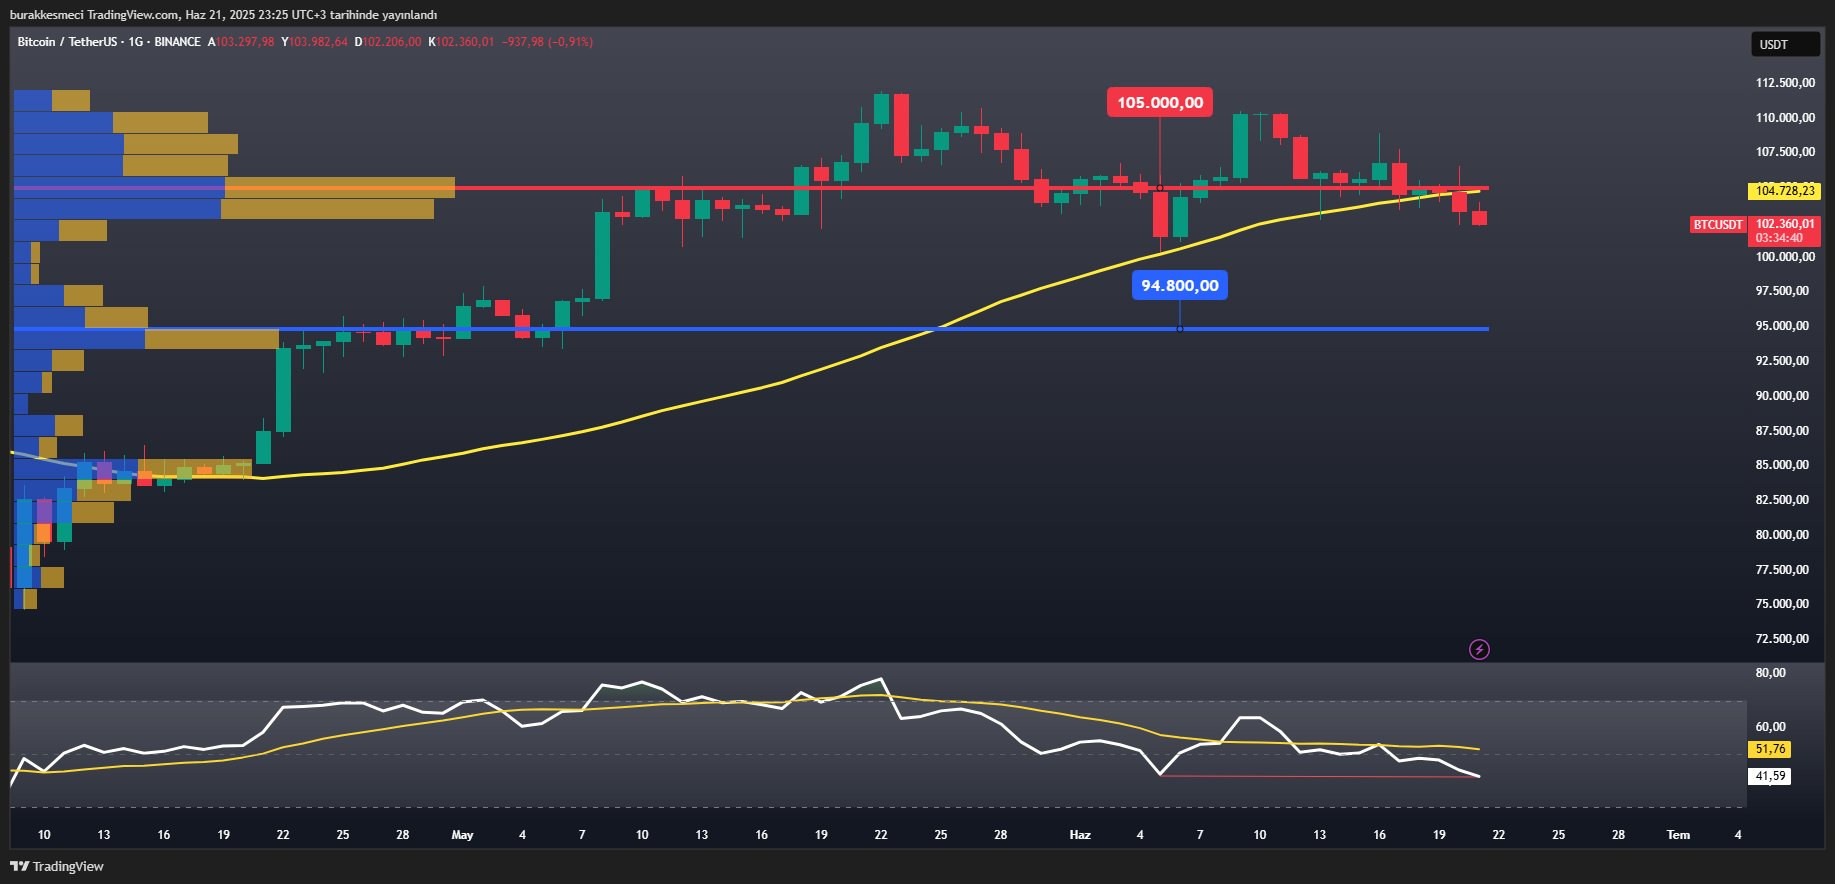
$95,000 Acting As A Barrier; Momentum Weakens
In a June 21 post on social media platform X, on-chain analyst Burak Kesmeci reiterated his earlier projection that the Bitcoin price could, in the short term, fall to the $93,000 to $94,000 price range. In his post, Kesmeci cited multiple technical indicators, which form the foundation of his bias.
The first of these highlighted indicators is the Fixed Range Volume Profile (FRVP) Intensive Swap Level (ISL), which is a refined support or resistance level derived from the FRVP showing key areas where buyer-seller dominance flipped with intensive volume.
According to Kesmeci, the FRVP intensive swap level is roughly $95,000, meaning this zone is a significant resistance level. The online pundit also noted that if Bitcoin’s price were to fail to stay above this price level, it could further increase the sell pressure in the cryptocurrency market.
Source: @burak_kesmeci on X
The analyst also identified the 50-day Simple Moving Average (SMA50) as critical to the short-term trend. Kesmeci highlighted that the SMA50 is almost at $105,000 — the same level which, interestingly, BTC is about to close below for the second time. If Bitcoin successfully closes below this SMA50, the on-chain analyst inferred that it could catalyze the downside movement of the flagship cryptocurrency.
The Relative Strength Index (RSI) also seems to support Kesmeci’s bearish stance. Currently at levels below 50 and beneath the 14-day SMA, the RSI signals that there is a loss of momentum in Bitcoin’s bullish movement.
As if it weren’t bad enough, Kesmeci also noted that lower lows are being formed in the RSI, and this stands as further proof that the market is currently seller-dominated.
‘Why I Am Waiting For $94,000’ — Kesmeci
To answer the question of why $94,000 is the next critical level to watch out for, Kesmeci explained that the VAL (Value Area Low) in the FRVP points to approximately $93,000 to $94,000. Burak made it clear that this level can act as a strong support zone to send the price back after BTC’s short-term sell-off.
Additionally, the crypto pundit referenced the 200-day Simple Moving Average (SMA200) as another confirmation of his bias. True enough, the SMA200 is observed to converge near $95,000. Amidst Bitcoin’s price fall, Burak advised that market participants stay prepared for the highlighted support zone, as good opportunities to buy might surface around it.
As of this writing, Bitcoin is valued at about $101,596, reflecting a 1.3% price decline over the past 24 hours.

The price of BTC on the daily timeframe | Source: BTCUSDT chart on TradingView
Featured image from iStock, chart from TradingView

Editorial Process for bitcoinist is centered on delivering thoroughly researched, accurate, and unbiased content. We uphold strict sourcing standards, and each page undergoes diligent review by our team of top technology experts and seasoned editors. This process ensures the integrity, relevance, and value of our content for our readers.