 Price Analysis for November 19 – U.Today")
The market is neutral in the middle of the week, according to CoinStats.
BTC/USD
The rate of Bitcoin (BTC) has declined by 0.64% over the last 24 hours.
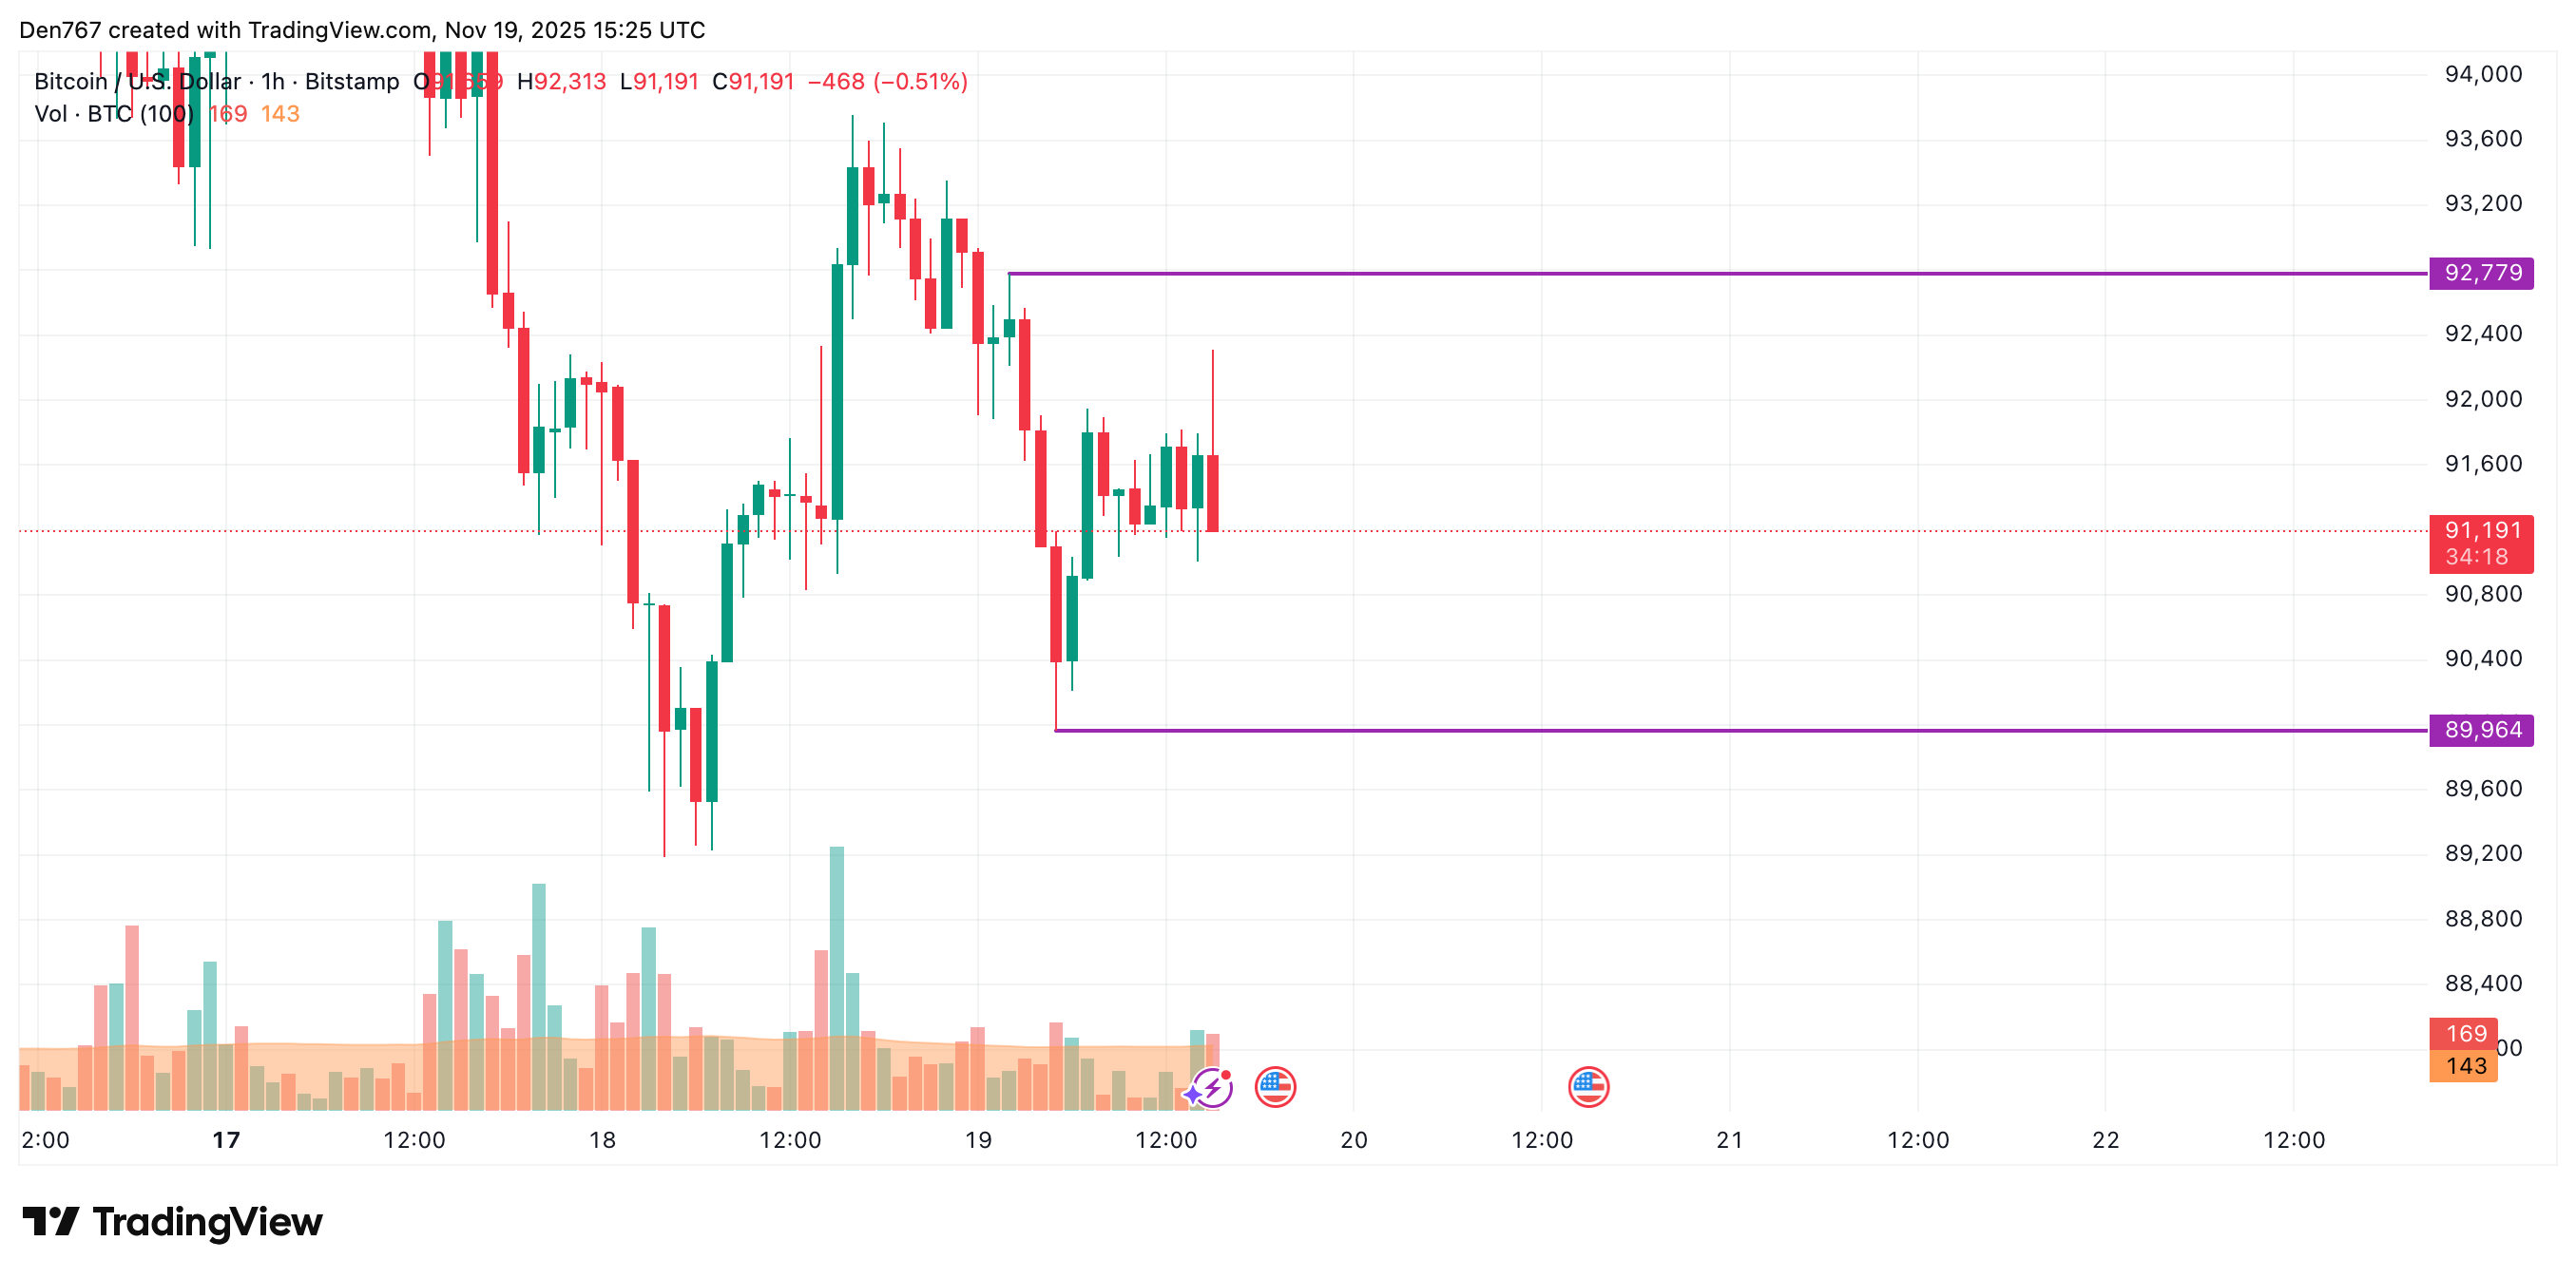
On the hourly chart, the price of BTC is in the middle of the local channel, between the support of $89,964 and the resistance of $92,779. As none of the sides is dominating, there are low chances of seeing increased volatility by tomorrow.
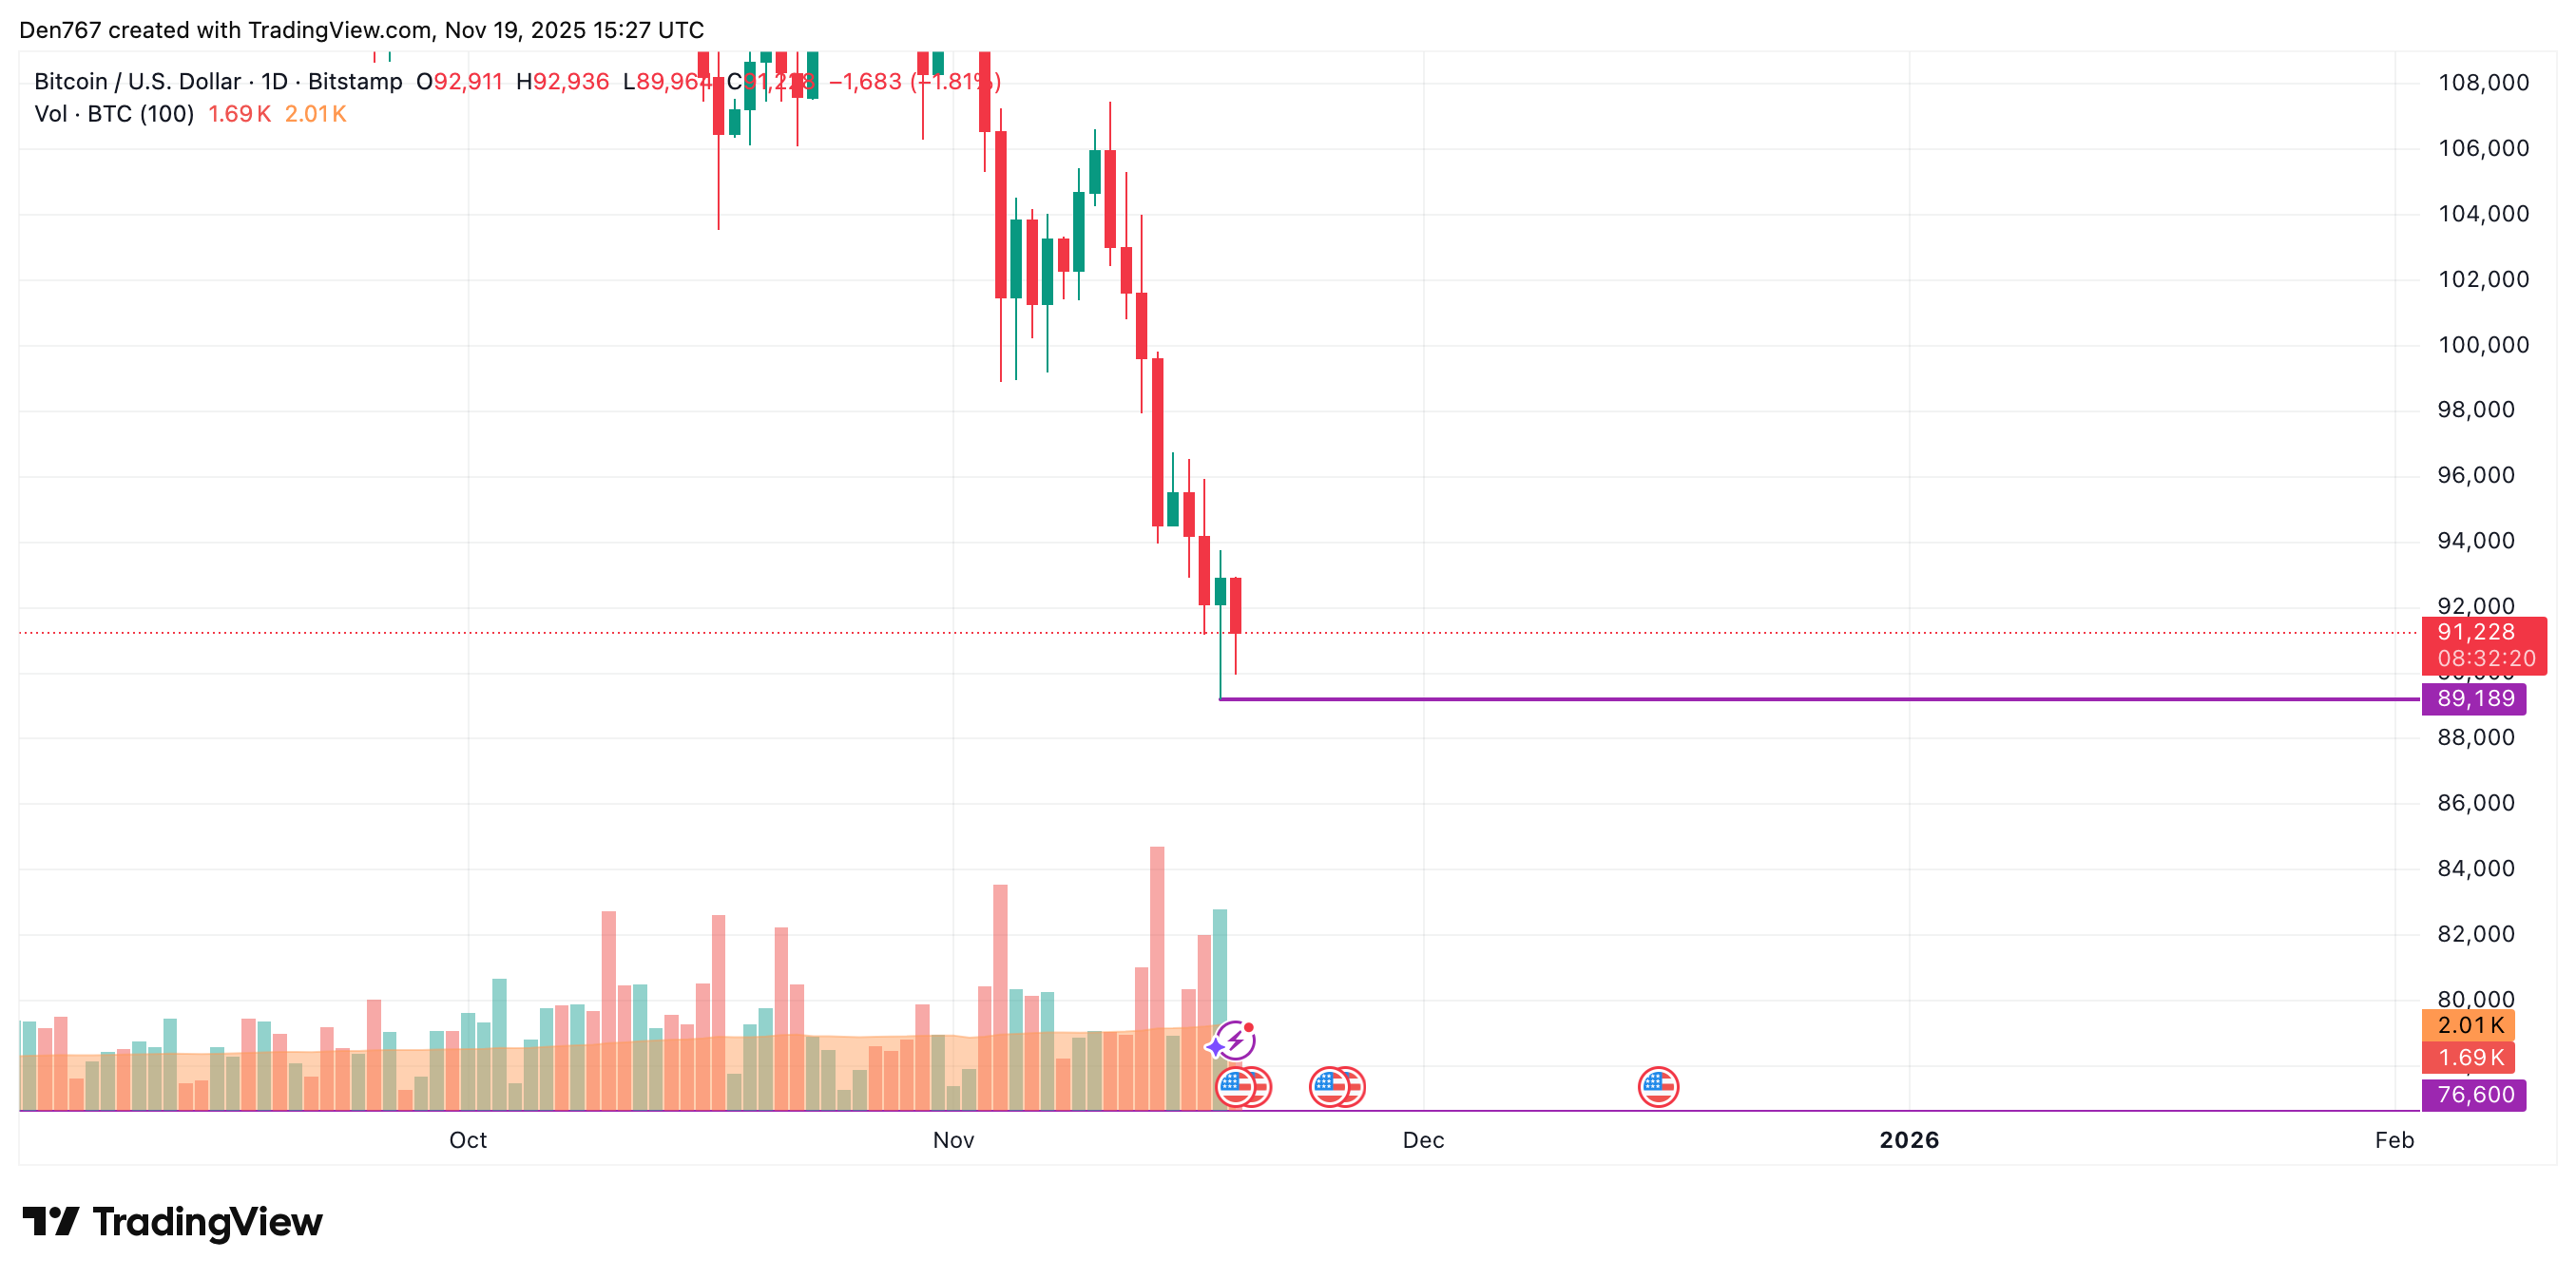
On the longer time frame, the rate of BTC is far from key levels. In this case, one should focus on yesterday’s bar’s low.
You Might Also Like

If the candle closes around that mark, the fall is likely to continue to the $86,000-$88,000 range.
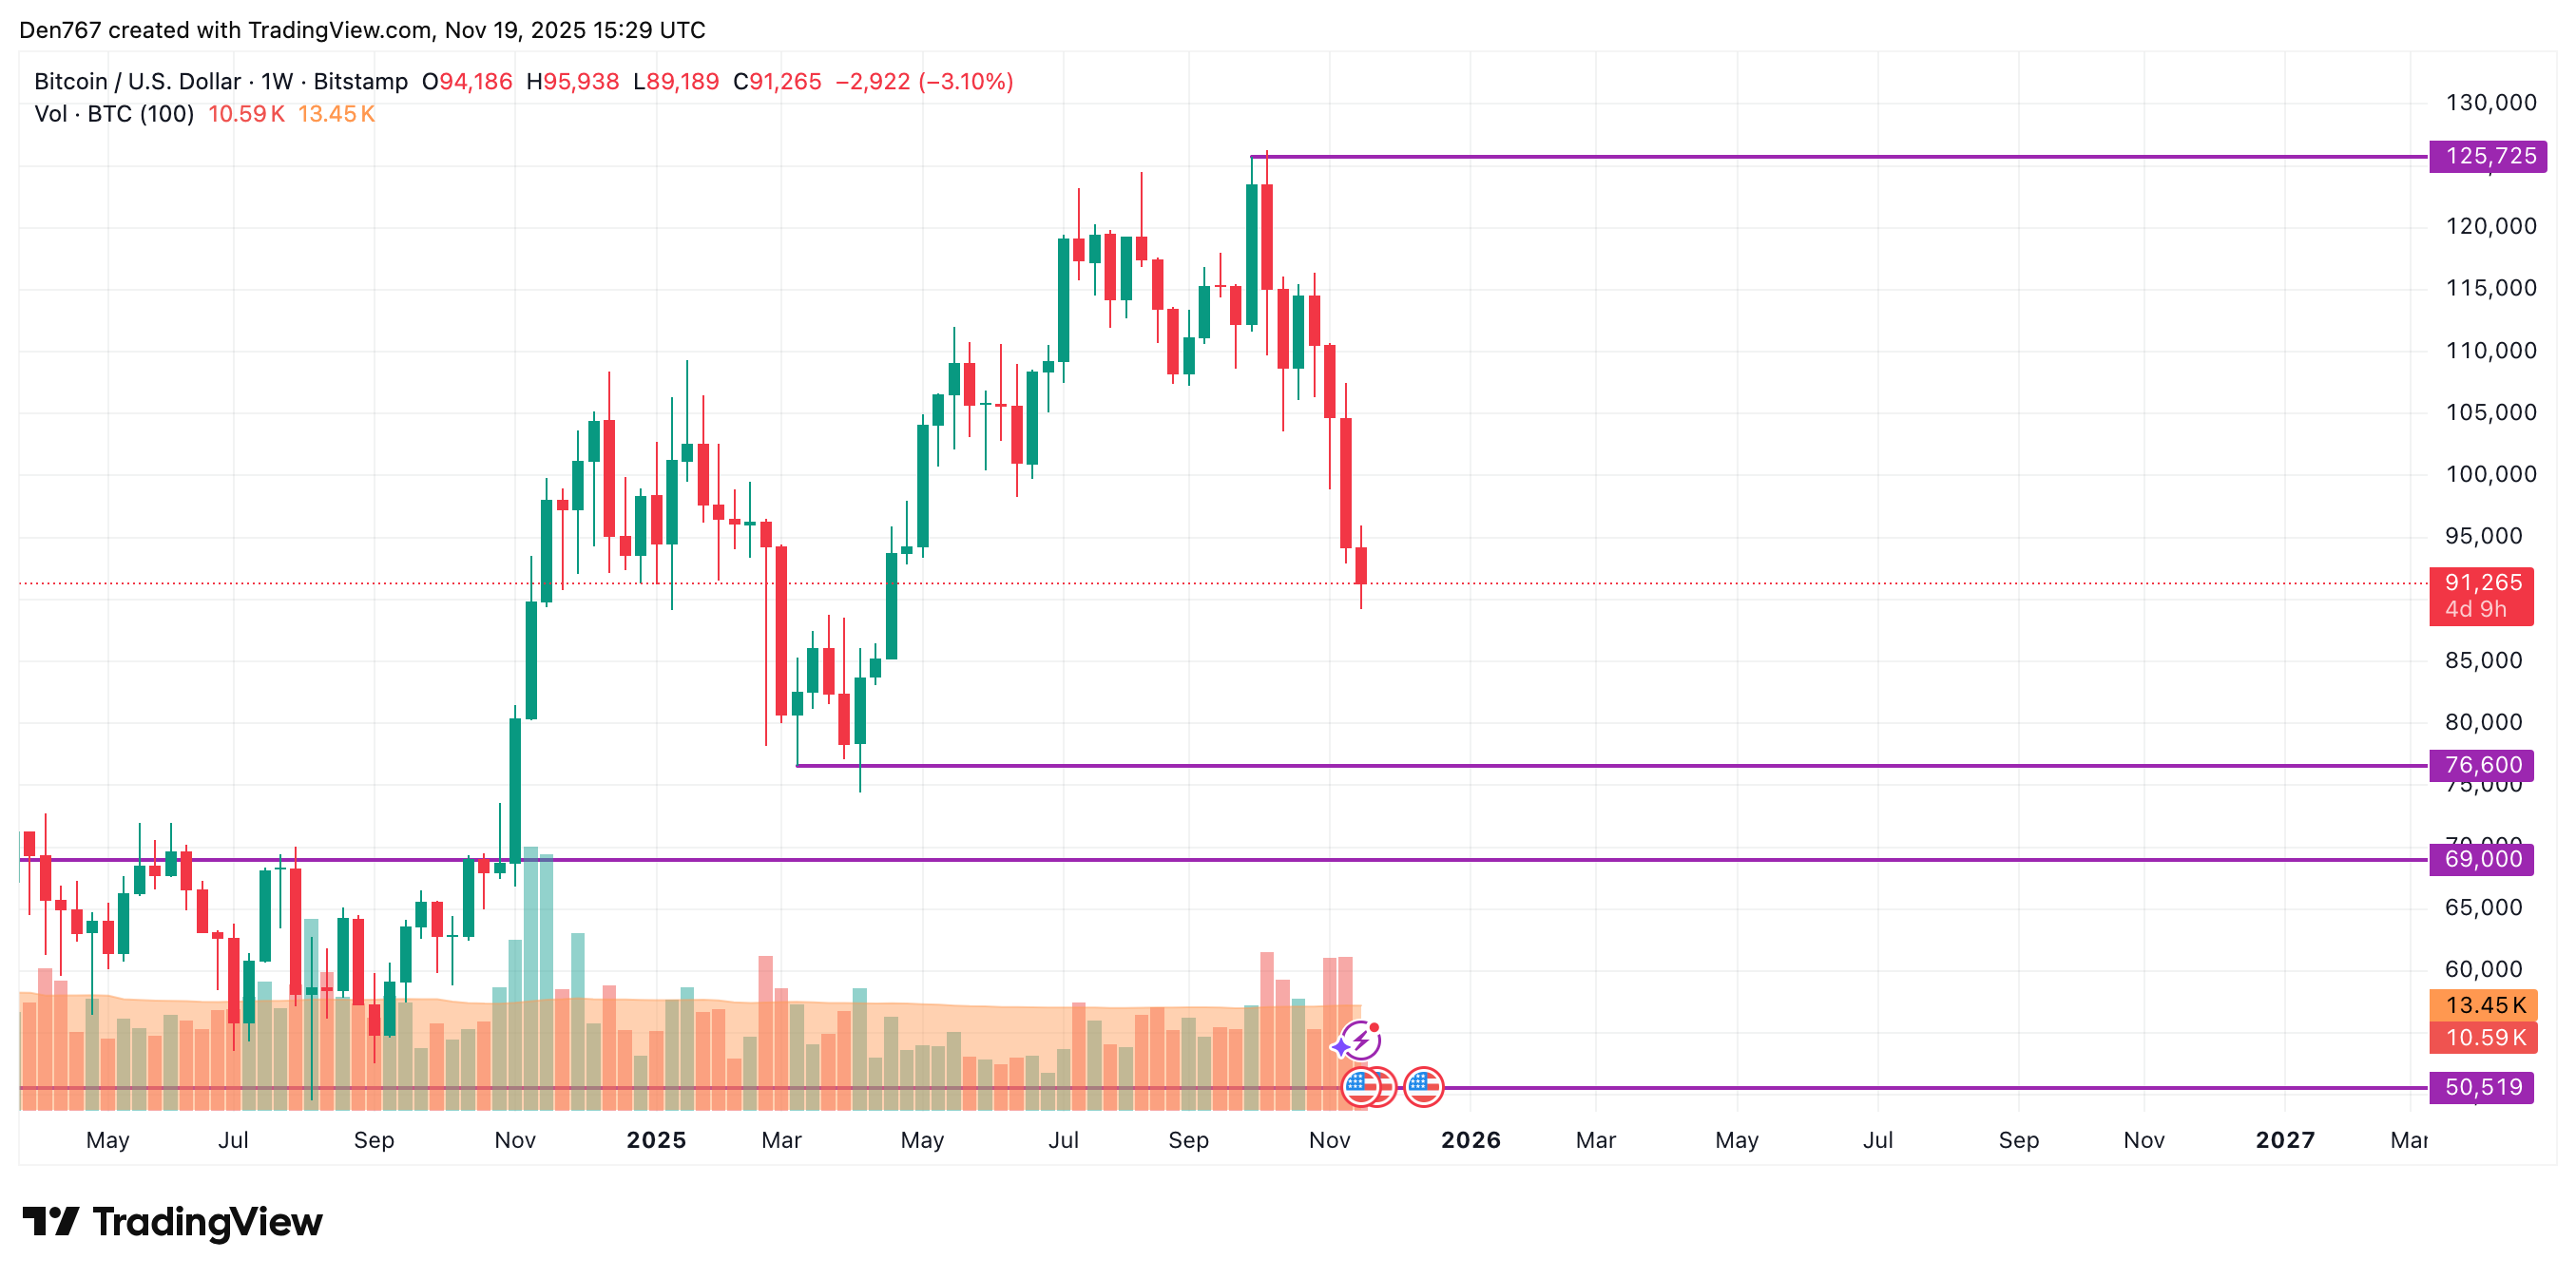
From the midterm point of view, sellers are more powerful than buyers. If bulls lose the $90,000 mark, the next zone where a bounce back may happen is $80,000-$85,000.
Bitcoin is trading at $91,265 at press time.