 Price Analysis for October 12 – U.Today")
The market is neutral on the last day of the week, according to CoinStats.
BTC/USD
The rate of Bitcoin (BTC) has fallen by 0.44% since yesterday.
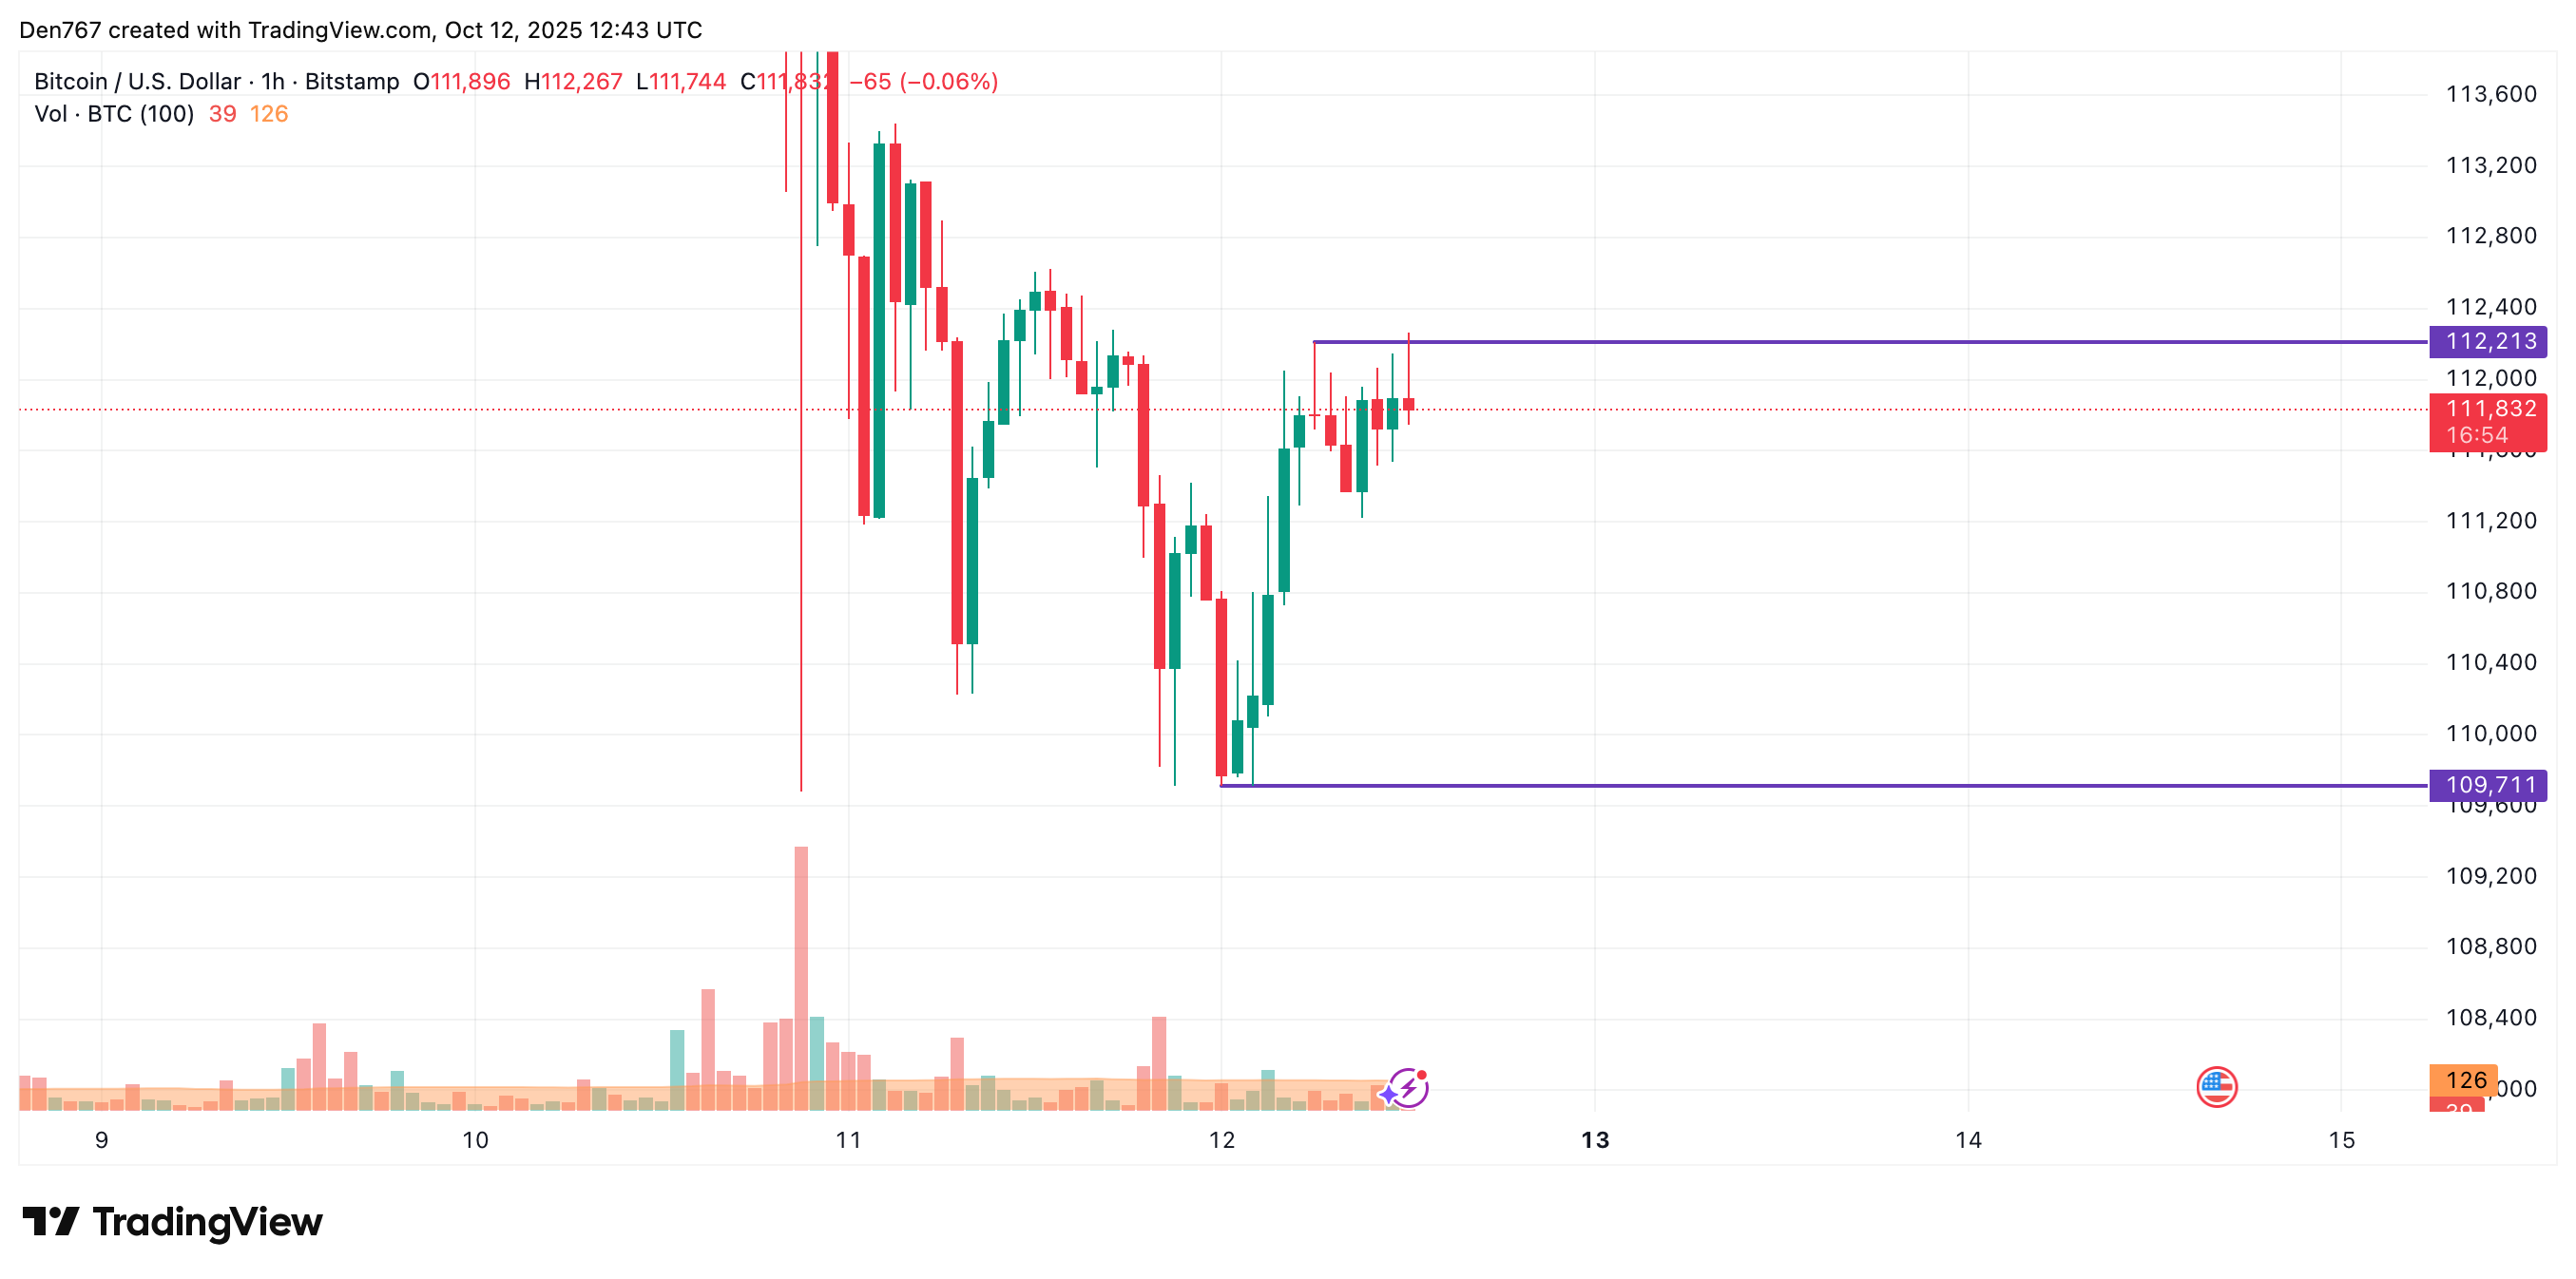
Despite today’s fall, the price of BTC is looking bullish on the hourly chart. If a breakout of the local resistance of $112,213 happens, the growth is likely to continue to the $113,000 mark.
On the bigger time frame, the rate of the main crypto has set a local support at $109,711. However, buyers might need more time to accumulate energy for a further move.
You Might Also Like

In this case, sideways trading in the narrow range of $111,000-$114,000 is the more likely scenario.
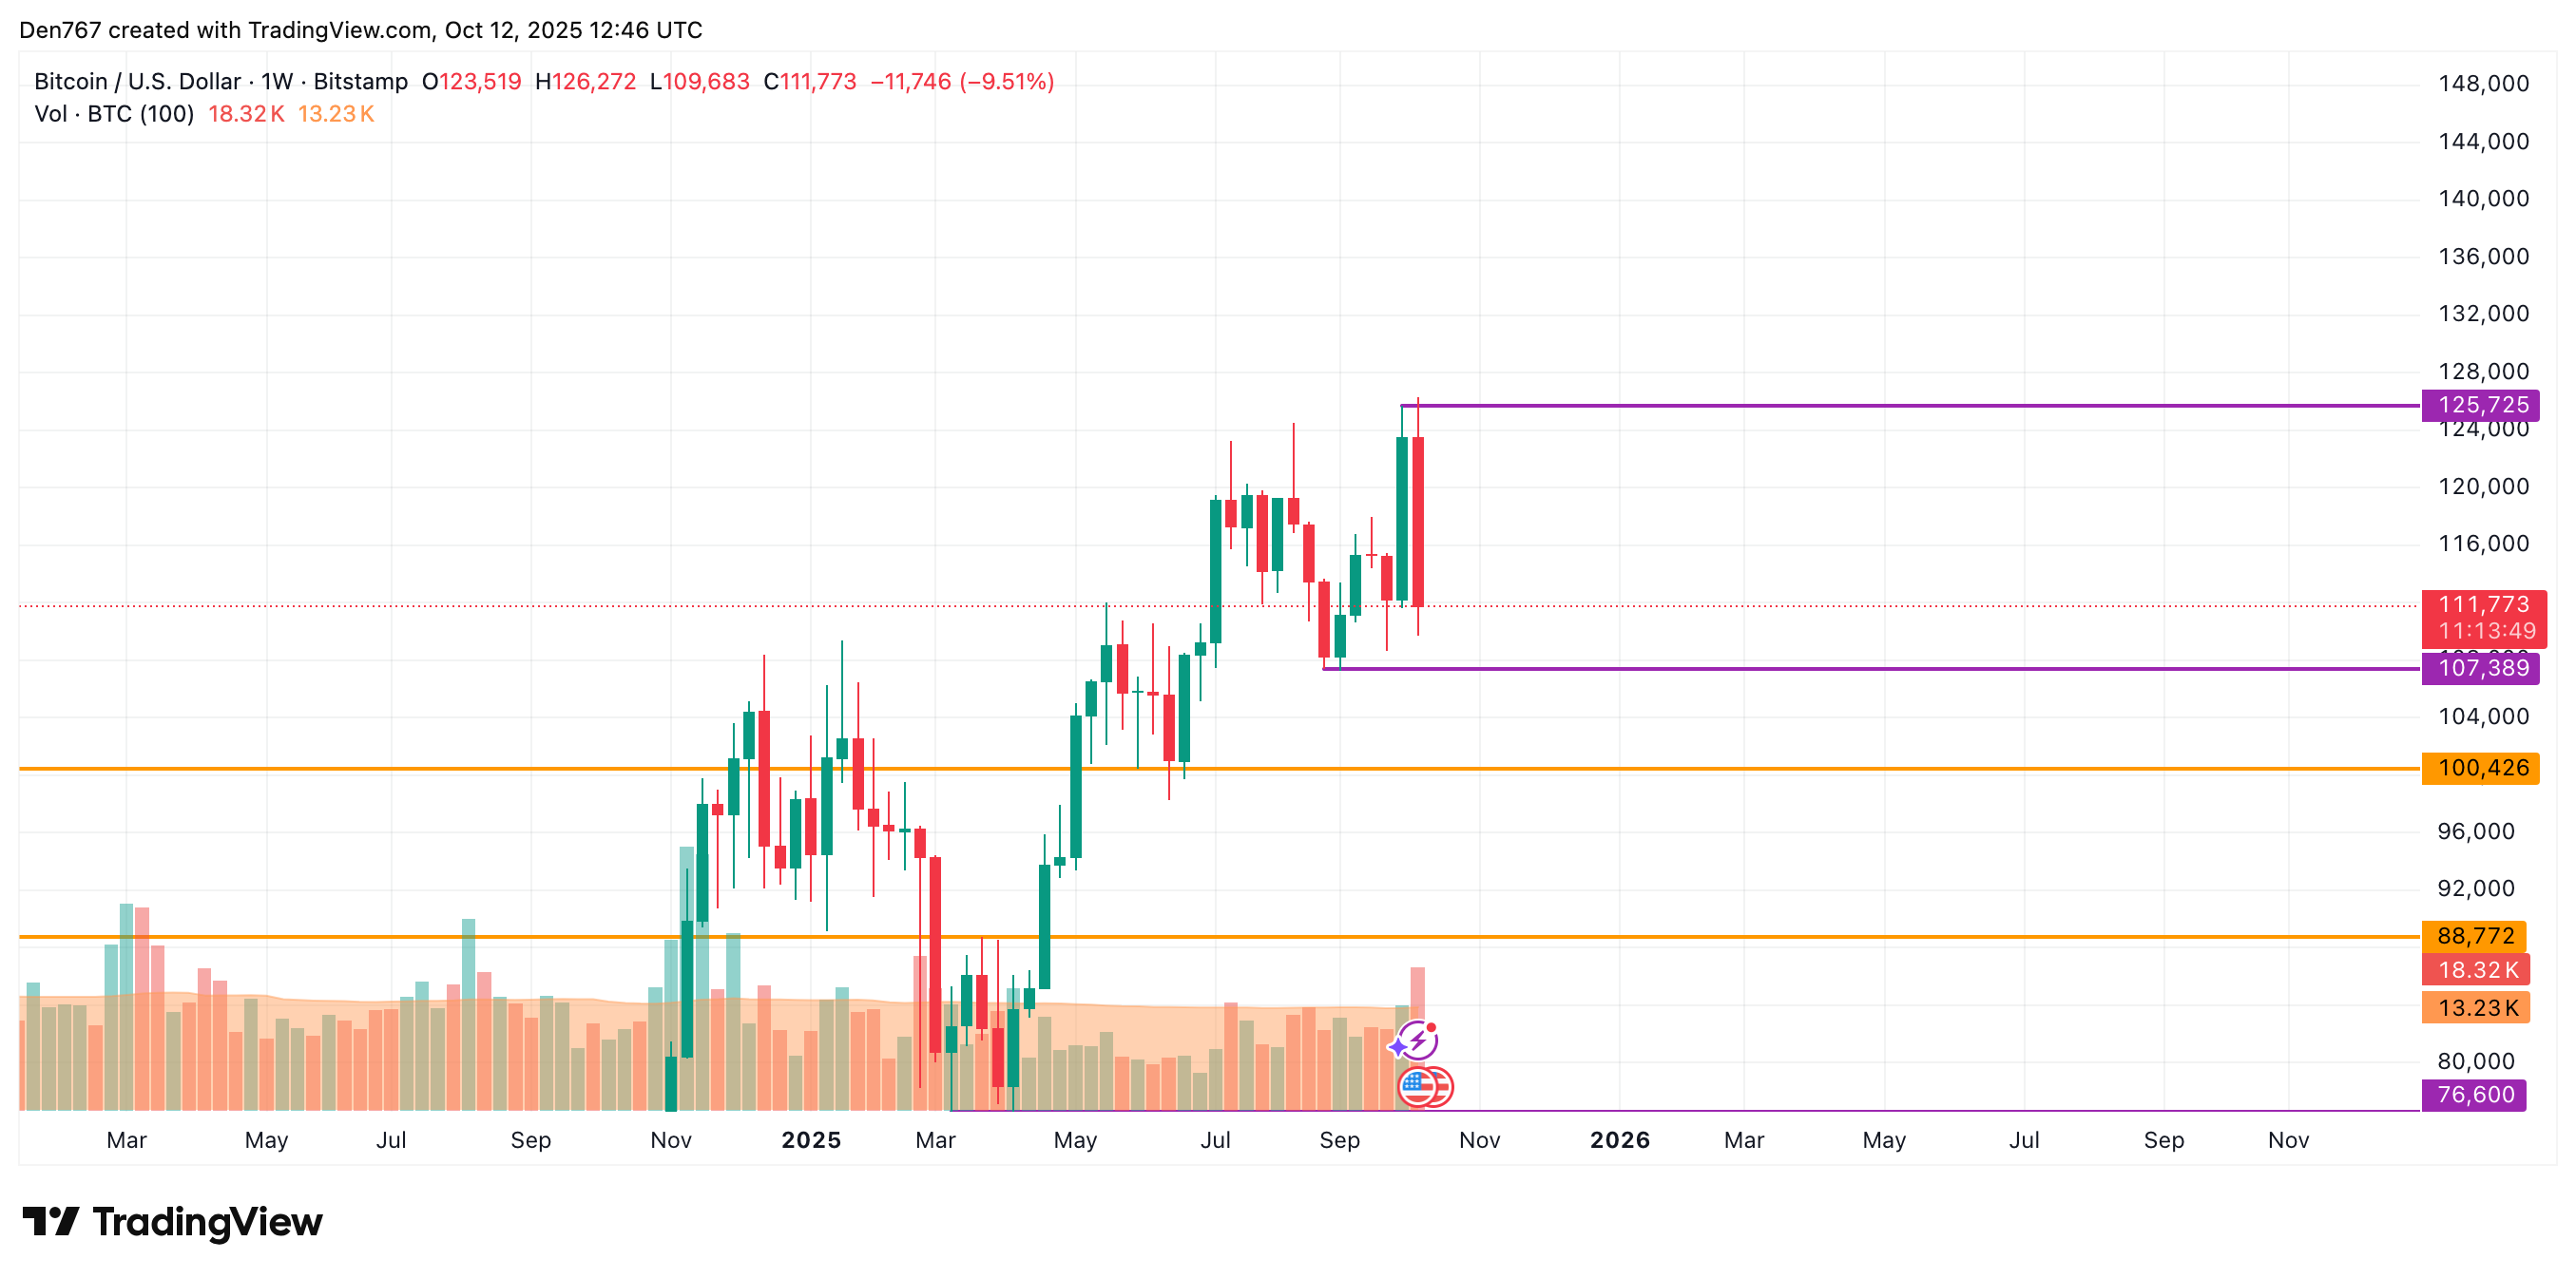
From the midterm point of view, the situation is bearish. If the weekly candle closes below the previous bar low ($111,597), there is a high probability to witness an ongoing correction to the $100,000-$105,000 area.
Bitcoin is trading at $111,773 at press time.