
Join Our Telegram channel to stay up to date on breaking news coverage
The Bitcoin price edged up a fraction of a percent in the past 24 hours to trade at $87,769 as of 2:40 a.m. EST on trading volume that dropped 7% to $66.1 billion.
This comes as the Texas state government bought $5 million of BlackRock’s iShares Bitcoin Trust (IBIT) spot BTC exchange-traded fund (ETF) at an average price of approximately $87,000 per bitcoin.
Lee Bratcher, president of the Texas Blockchain Council, highlighted the buy in a post on X.
TEXAS BOUGHT THE DIP!
Texas becomes the FIRST state to purchase Bitcoin with a $10M investment on Nov. 20th at an approximately $87k basis!
Congratulations to Comptroller @KHancock4TX and the dedicated investments team at Texas Treasury who have been watching this market… pic.twitter.com/wsMqI9HrPD— Lee ₿ratcher (@lee_bratcher) November 25, 2025
Another $5 million has been set aside for additional direct purchases of Bitcoin.
Still in the US, Congressman Warren Davidson says that the US can fund its Bitcoin Reserve by accepting taxes in Bitcoin, which is exactly what the Bitcoin for America Act, a bill he introduced, enables.
Allowing Americans to pay federal taxes in Bitcoin will benefit the U.S. by having an asset that appreciates over time—unlike the U.S. dollar, which has been crushed by inflation.
Congress should pass my Bitcoin for America Act & give the U.S a stronger financial foundation! pic.twitter.com/ADvMEYGv66
— Rep. Warren Davidson (@Rep_Davidson) November 25, 2025
In another positive development for Bitcoin and crypto broadly, Bloomberg reported that pro-crypto Kevin Hassett is US President Donald Trump’s preferred candidate to succeed Jerome Powell at the helm of the Federal Reserve.
The odds that Hassett succeeds Powell have surged to 58% on prediction market Kalshi
As the former chair of the Council of Economic Advisers, Hasset is known for advocating rate cuts and maintaining direct ties to the crypto industry. He has declared that he owns about $1 million worth of Coinbase shares.
Kevin Hassett is now the leading candidate for Fed chair, he has recently backed a 50 basis point cut in December. The 10-year Treasury yield is already below 4%, reflecting growing market confidence. Looking forward, I believe the 10-year could drop further, targeting the 3% to…
— Steve Grasso (@grassosteve) November 25, 2025
Bitcoin Price Gearing Up Toward A Recovery
After touching an all-time high (ATH) above $126,000 in October, the BTC price has been in a sustained downtrend, fueled by a death cross formed around the $116,000 level.
The Bitcoin price has since been traded within a well-defined falling channel pattern to the support area around $82,000.
This support on the lower boundary of the falling channel allowed the bulls to stage a recovery above the midline level of the channel.
As a result of the slight recovery, the price of BTC has now crossed above the 50-day SMA at $87,451 on the 4-hour chart.
Meanwhile, the 200-day SMA still acts as the next possible resistance at $100,782 if BTC manages to break out of the falling channel.
The Relative Strength Index (RSI) has also turned positive, now hovering around the 50-midline level, currently at 55 and climbing, which may suggest that the price of Bitcoin may be on a recovery.
Furthermore, the Moving Average Convergence Divergence (MACD) indicates a shift towards positive momentum, with the blue MACD line crossing above the orange signal line.
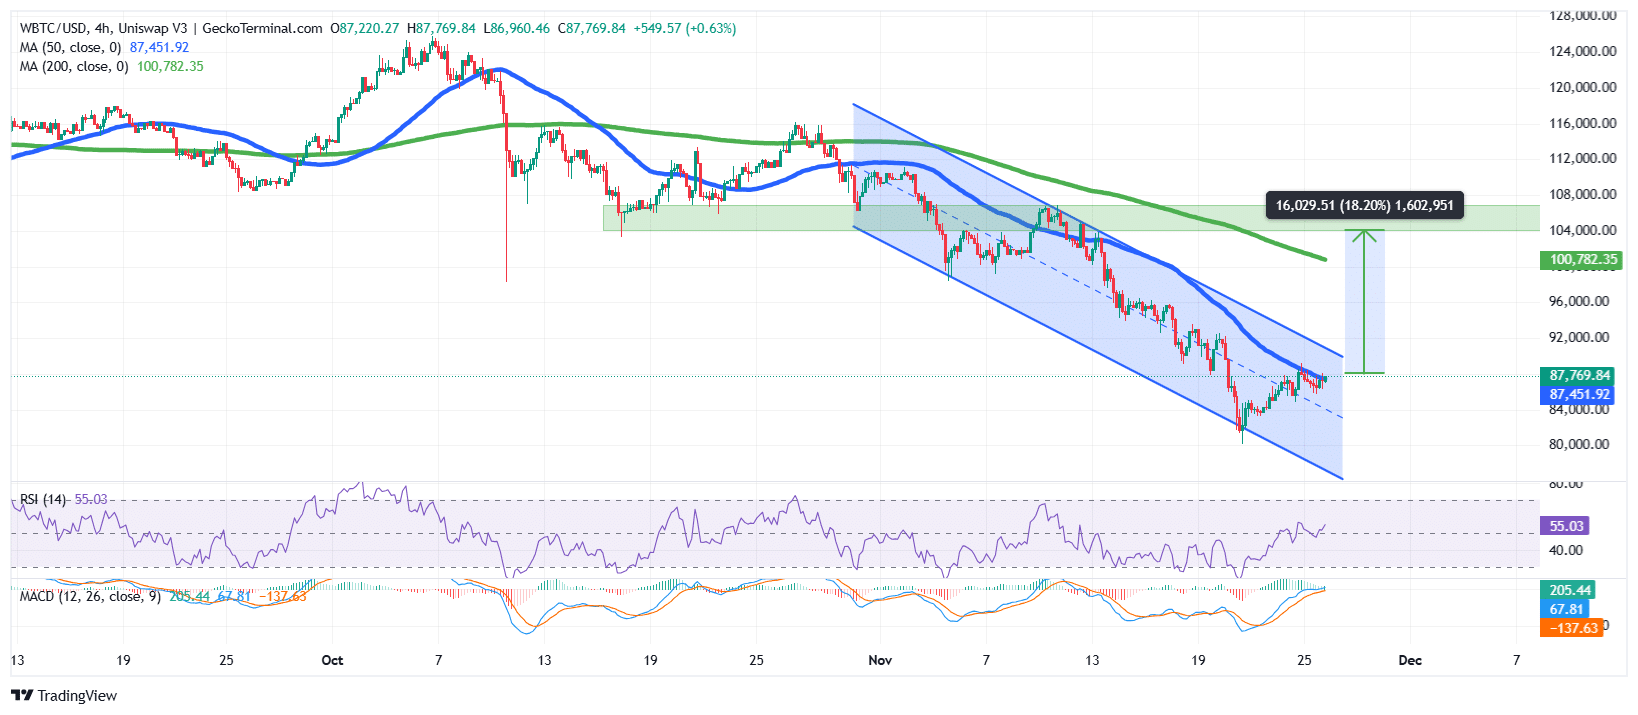
BTC Price Bulls Target The $104K Resistance
According to the BTC/USD chart analysis on the 4-hour chart, the Bitcoin price is attempting a recovery from a bearish downtrend.
If the price surges above the upper boundary of the falling channel, the next possible target is the $104,053 resistance, an 18% surge from the current level.
Conversely, if the bearish move within the falling channel continues, the BTC price could drop back to the $80,000 zone.
Ali Martinez, an influential analyst on X with over 163,000 followers, further supports this narrative. He says that on the 1-hour chart BTC is forming a bearish flag, and could lead to a drop towards the $79,000 zone.
If this is a bearish flag, Bitcoin $BTC could be heading toward $79,000. pic.twitter.com/FGFjWSmpcg
— Ali (@ali_charts) November 25, 2025
Related News:
Best Wallet – Diversify Your Crypto Portfolio

- Easy to Use, Feature-Driven Crypto Wallet
- Get Early Access to Upcoming Token ICOs
- Multi-Chain, Multi-Wallet, Non-Custodial
- Now On App Store, Google Play
- Stake To Earn Native Token $BEST
- 250,000+ Monthly Active Users
Join Our Telegram channel to stay up to date on breaking news coverage