
Crypto analyst Kevin (Kev Capital TA) told viewers late on September 25 that Bitcoin’s pullback is tracking a familiar seasonal and structural script—and that the market’s next major impulse hinges on a clearly defined support range. “Hold $107k to $98K,” he said, calling the zone the fulcrum for the bull cycle’s next leg. “That’s it. It’s that simple.”
Opening his stream amid a rush of bearish sentiment as BTC price dipped to $108,651, Kevin argued the drawdown should not surprise disciplined traders. He framed the current move in the context of months of caution dating back to early August, when he began highlighting weekly bearish divergences across Bitcoin, Ethereum and the total altcoin market (Total2), into what he described as four-plus-year resistance zones.
“Everyone thinks these symmetrical triangle patterns after a move higher are continuation patterns,” he said, “but in reality, in the crypto market, very, very rarely do these break out to the upside.” He pointed to a progression of smaller impulse highs since late 2023 and reiterated that despite sharp rallies in select altcoins, the majors failed to clear “any major resistance levels.”
Bitcoin Top In Until Proven Otherwise
The anchor of Kevin’s case is confluence on higher time frames. On Bitcoin’s weekly chart, he outlined rising price highs against falling momentum—“simple strength and momentum indicators,” not signals by themselves but context that “has been dwindling for a very long time.”
Related Reading
Total2, he added, registered “a triple top on the weekly” beneath roughly $1.71–$1.74 trillion—“the all-be-all resistance level”—with weekly RSI and MACD rolling over. Stocks of momentum, in his read, are resetting precisely where they should amid historically thin late-summer liquidity. “Q3 is never a good quarter for crypto,” Kevin said. “August, September are terrible months. They always are.”
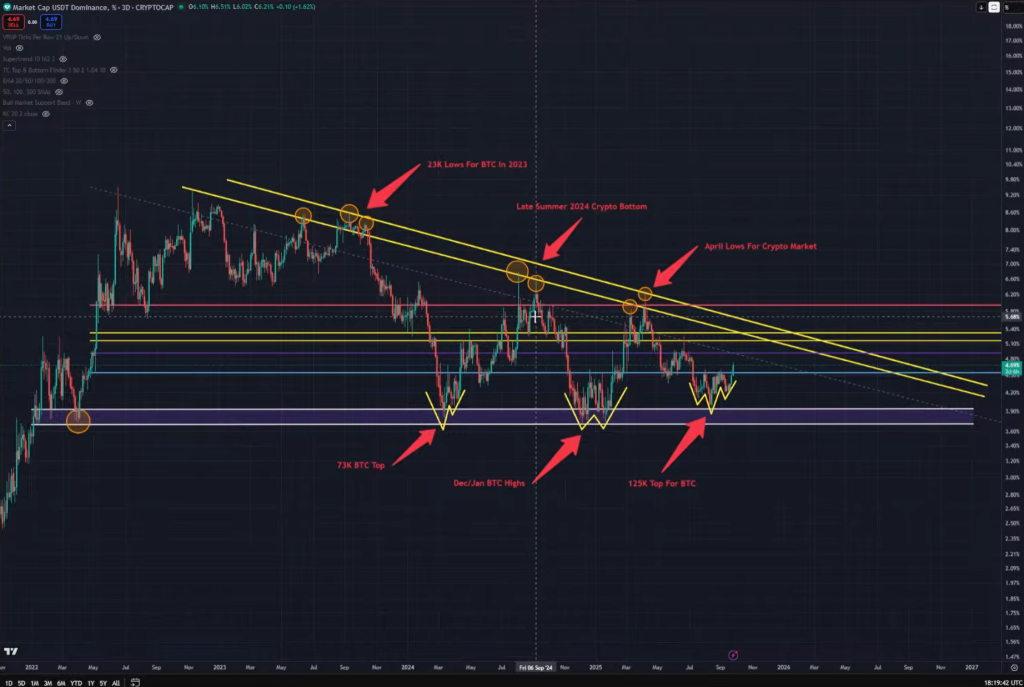
Against that backdrop, he argued that USDT dominance remains the most reliable inter-market compass. “USDT dominance is the greatest chart ever. There is no better chart,” he said, walking through a macro descending triangle with a flat-bottom support near 3.9–3.7% and repeated rallies to a falling trendline that have mapped crypto cycle lows and highs for two years.
Each approach to the flat bottom, he noted, has carved a W- or inverse-head-and-shoulders-style base in USDT.D while Bitcoin distributed near local tops; each rejection at the downtrend has coincided with crypto inflections. “You literally don’t need any chart in all of crypto,” he said. “All you need is Bitcoin and USDT dominance and you would have played this cycle absolutely perfectly.”
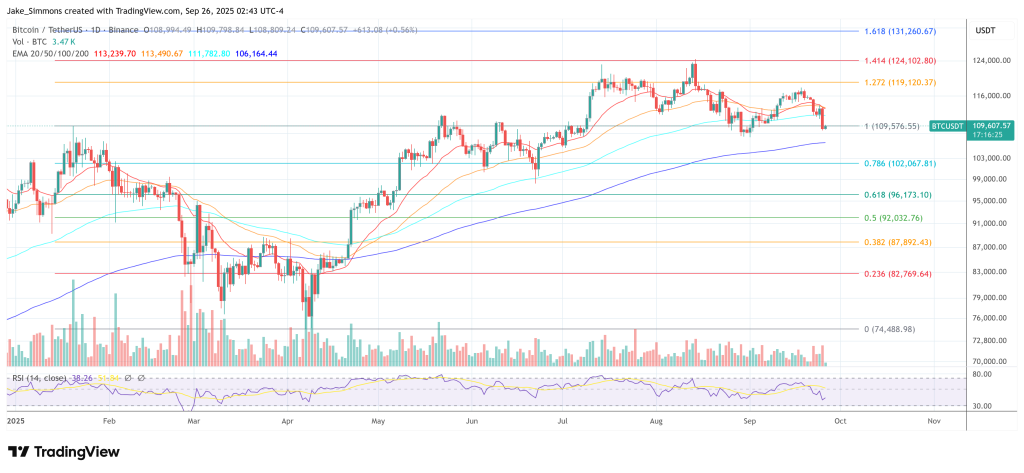
From a tactical standpoint, Kevin flagged a three-month BTC liquidity “heat map” shelf near $106.8K and the 21-week EMA—the bull-market support band—near $109.2K as natural magnets, with the lower weekly Bollinger Band sitting around $101K.
He stressed he doesn’t want to see “Bitcoin lose 106.8K” if the cycle remains intact, though a wick into that area to “swipe the liquidity” would be consistent with prior resets. He framed $98K as the line that should not break decisively. “There’s a whole lot of support in that range,” he said. “I’d be pretty shocked if Bitcoin wasn’t able to bounce in there somewhere.”
All Eyes On Q4 Seasonality
Kevin tied structural signals to an explicit macro checklist, arguing that lasting cycle tops and bottoms align with fundamental catalysts rather than charts alone. He cited 2021’s inflation spike and the onset of the Fed’s hiking cycle as the driver of that cycle’s 55–60% drawdown, the 2017 CME Bitcoin futures launch as a blow-off top catalyst, and the FTX collapse as the final capitulation in 2022 amid weekly bullish divergence.
“There’s always a macro-related reason that correlates with the charts,” he said. By contrast, he sees no such cycle-ending macro trigger today: inflation gauges have been “very choppy” but contained; the Fed is widely expected to ease into year-end provided labor softens; and seasonality favors Q4.
Related Reading
He underscored the near-term calendar—core PCE, CPI and labor data in the first half of October—as decisive for risk appetite. “Sometime in mid-October… we’ll start to have an idea of where this market is really going to go,” he said. “If we get to mid-October and Bitcoin’s holding key support… and we get good macroeconomic data, we get another rate cut… the probabilities favor that Bitcoin will [go higher]—and then you’re in Q4.”
Volatility positioning, he added, argues for a sharp directional move once the reset completes. On the weekly Bollinger Band Width, Kevin said BTC has printed record-low readings three times this cycle—each in Q3—and each episode began with a downside break of 18–29% before surging to fresh highs.
“There is a massive move coming for Bitcoin soon. It has not happened yet,” he said, noting spot volumes have declined since November while bands have tightened to historic extremes. A test of the lower weekly band near $101K “is possible,” but not required, in his view; the key is that the broader $107K–$98K corridor functions as a springboard.
Kevin was equally explicit about invalidation and upside triggers. He labeled $125K “a major top for now” and said the market needs weekly and monthly closes above that level to confirm trend continuation.
On dominance, he highlighted 59.0% and 60.28% as near-term resistance that could fuel a BTC-led phase if reclaimed; otherwise, he expects leadership to rotate back to altcoins once Bitcoin bases and USDT dominance prints a lower high. “Stop looking at the altcoins” until those inter-market signals flip, he advised, emphasizing patience, risk management and taking profits into resistance.
His bottom line combines restraint with opportunism. “Hold $107k to 98K,” he repeated. “Go into October. Get through the first couple of weeks of macroeconomic data… Bitcoin will inevitably find a low on the back of that data and then eventually go higher.” But he warned that if macro arrives benign and “Bitcoin is still deteriorating,” traders should be ready to reassess the cycle thesis. Until then, Kevin’s message remains unapologetically unglamorous: respect the seasonal chop, track the inter-market tells, and let the higher-time-frame levels do the talking. “Being right is the best pat on the back you can get,” he said. “Not just saying things that get you a lot of clicks.”
At press time, BTC traded at $109,607.
Featured image created with DALL.E, chart from TradingView.com