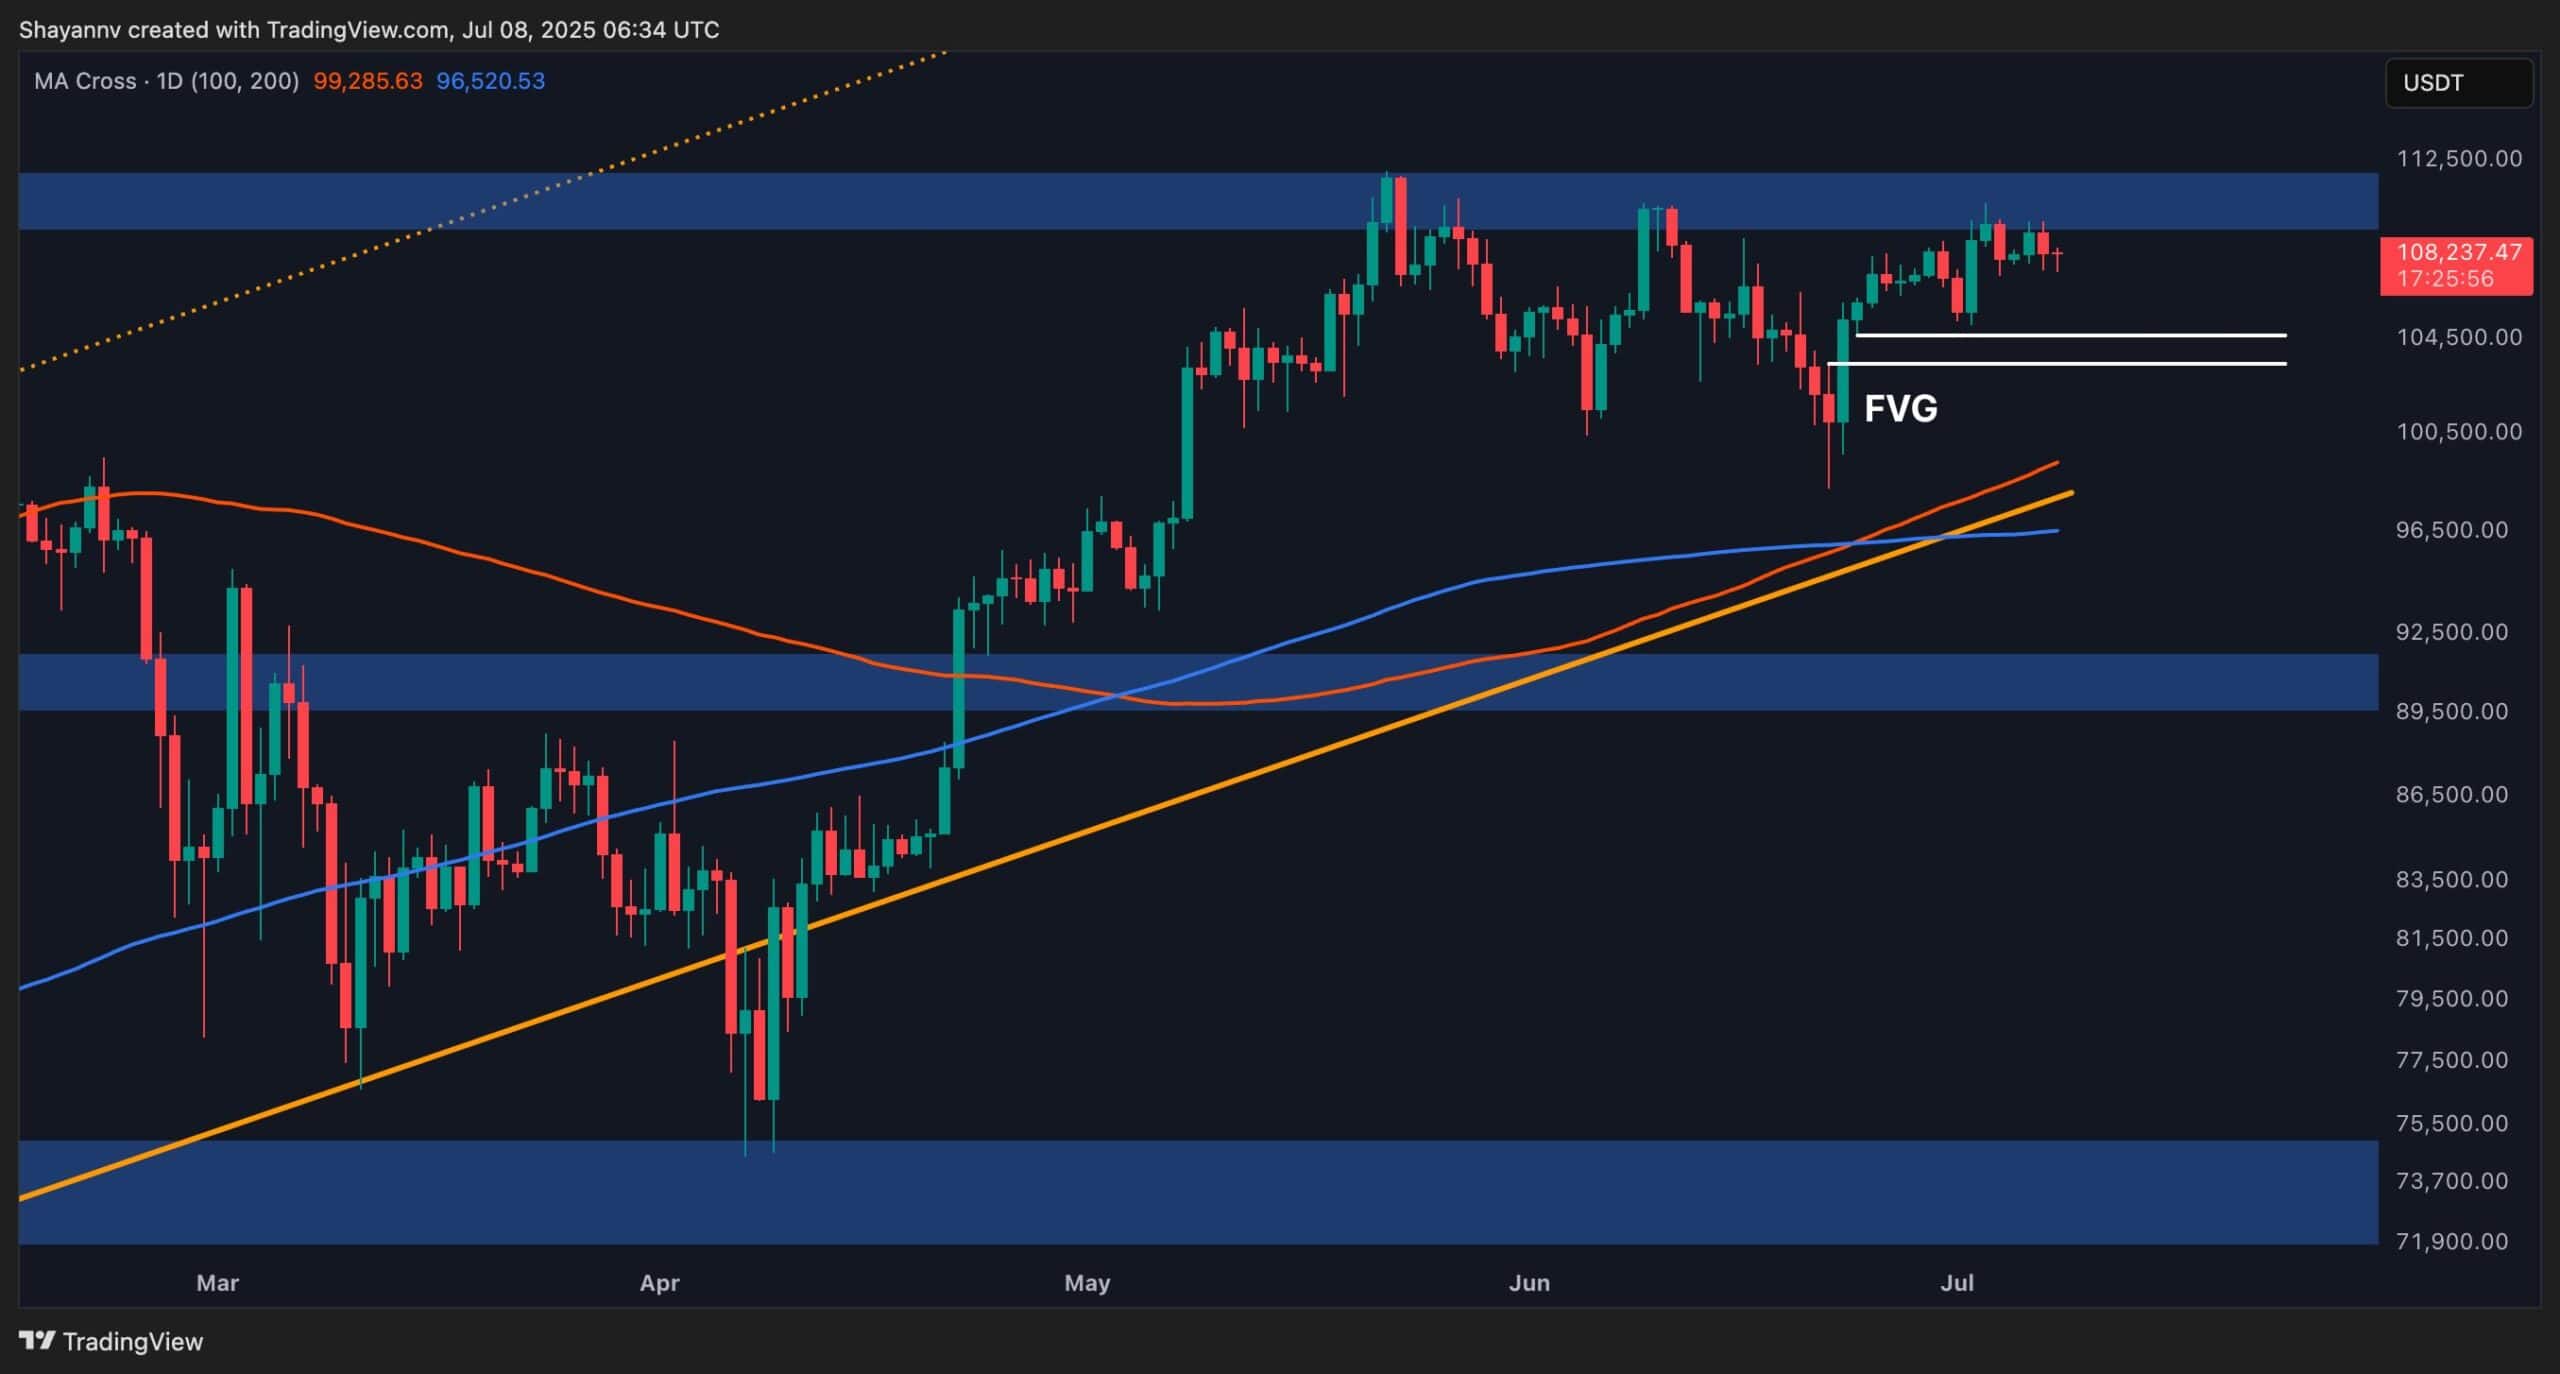
Bitcoin has slightly lost its bullish steam upon nearing the $111K all-time high, with strong selling pressure emerging at this key level.
The price continues to struggle in reclaiming this threshold, signaling a likely period of consolidation or corrective movement in the days ahead.
Technical Analysis
By ShayanMarkets
The Daily Chart
Bitcoin’s bullish rally toward its all-time high of $111K has shown signs of exhaustion, with the price losing momentum near this key resistance. The inability to reclaim the previous high around $110K suggests the potential formation of a double-top pattern, a classic bearish reversal signal.
Currently, BTC is consolidating within a critical price range, bounded by the $111K ATH and a fair value gap between $103K and $104K. Given the visible weakness in bullish momentum, a short-term rejection and further consolidation within this zone are likely. That said, the FVG may act as a significant demand zone, potentially halting any deeper corrections and providing the base for another upward attempt toward the $111K mark.
The 4-Hour Chart
On the 4-hour timeframe, BTC failed to print a new higher high above $110K, encountering notable rejection at this resistance. This price action confirms the presence of heightened selling pressure and distribution behavior near the ATH zone, reinforcing $111K as a key barrier.
Bitcoin now trades between two prominent liquidity zones: one just below $105K and the other above $110K. These liquidity pools are attractive targets for institutional players and could drive price volatility in the short term. As such, a range-bound movement is expected between these levels until a decisive breakout occurs, likely triggered by a liquidity sweep in either direction.
Sentiment Analysis
By ShayanMarkets
Over the past 45 days, taker users on Binance Derivatives have persistently engaged in sell-side activity. Despite this, Bitcoin has remained range-bound between $100K and $110K, while the Cumulative Volume Delta (CVD) has shown a consistent negative trend throughout the period.
The CVD, which measures the net flow of buy and sell volume in real time, highlights a clear dominance of aggressive selling pressure. However, the price’s ability to hold steady, without further decline, points to a potential absorption phase, likely directed by institutional investors or large-scale players quietly accumulating.
This ongoing divergence between persistent sell-side flow and stable price action suggests that Bitcoin may be forming a strong base. If the current structure holds, with continued absorption within the range, the likelihood of a bullish breakout increases, potentially setting the stage for a renewed uptrend.
Binance Free $600 (CryptoPotato Exclusive): Use this link to register a new account and receive $600 exclusive welcome offer on Binance (full details).
LIMITED OFFER for CryptoPotato readers at Bybit: Use this link to register and open a $500 FREE position on any coin!
Disclaimer: Information found on CryptoPotato is those of writers quoted. It does not represent the opinions of CryptoPotato on whether to buy, sell, or hold any investments. You are advised to conduct your own research before making any investment decisions. Use provided information at your own risk. See Disclaimer for more information.
Cryptocurrency charts by TradingView.
