
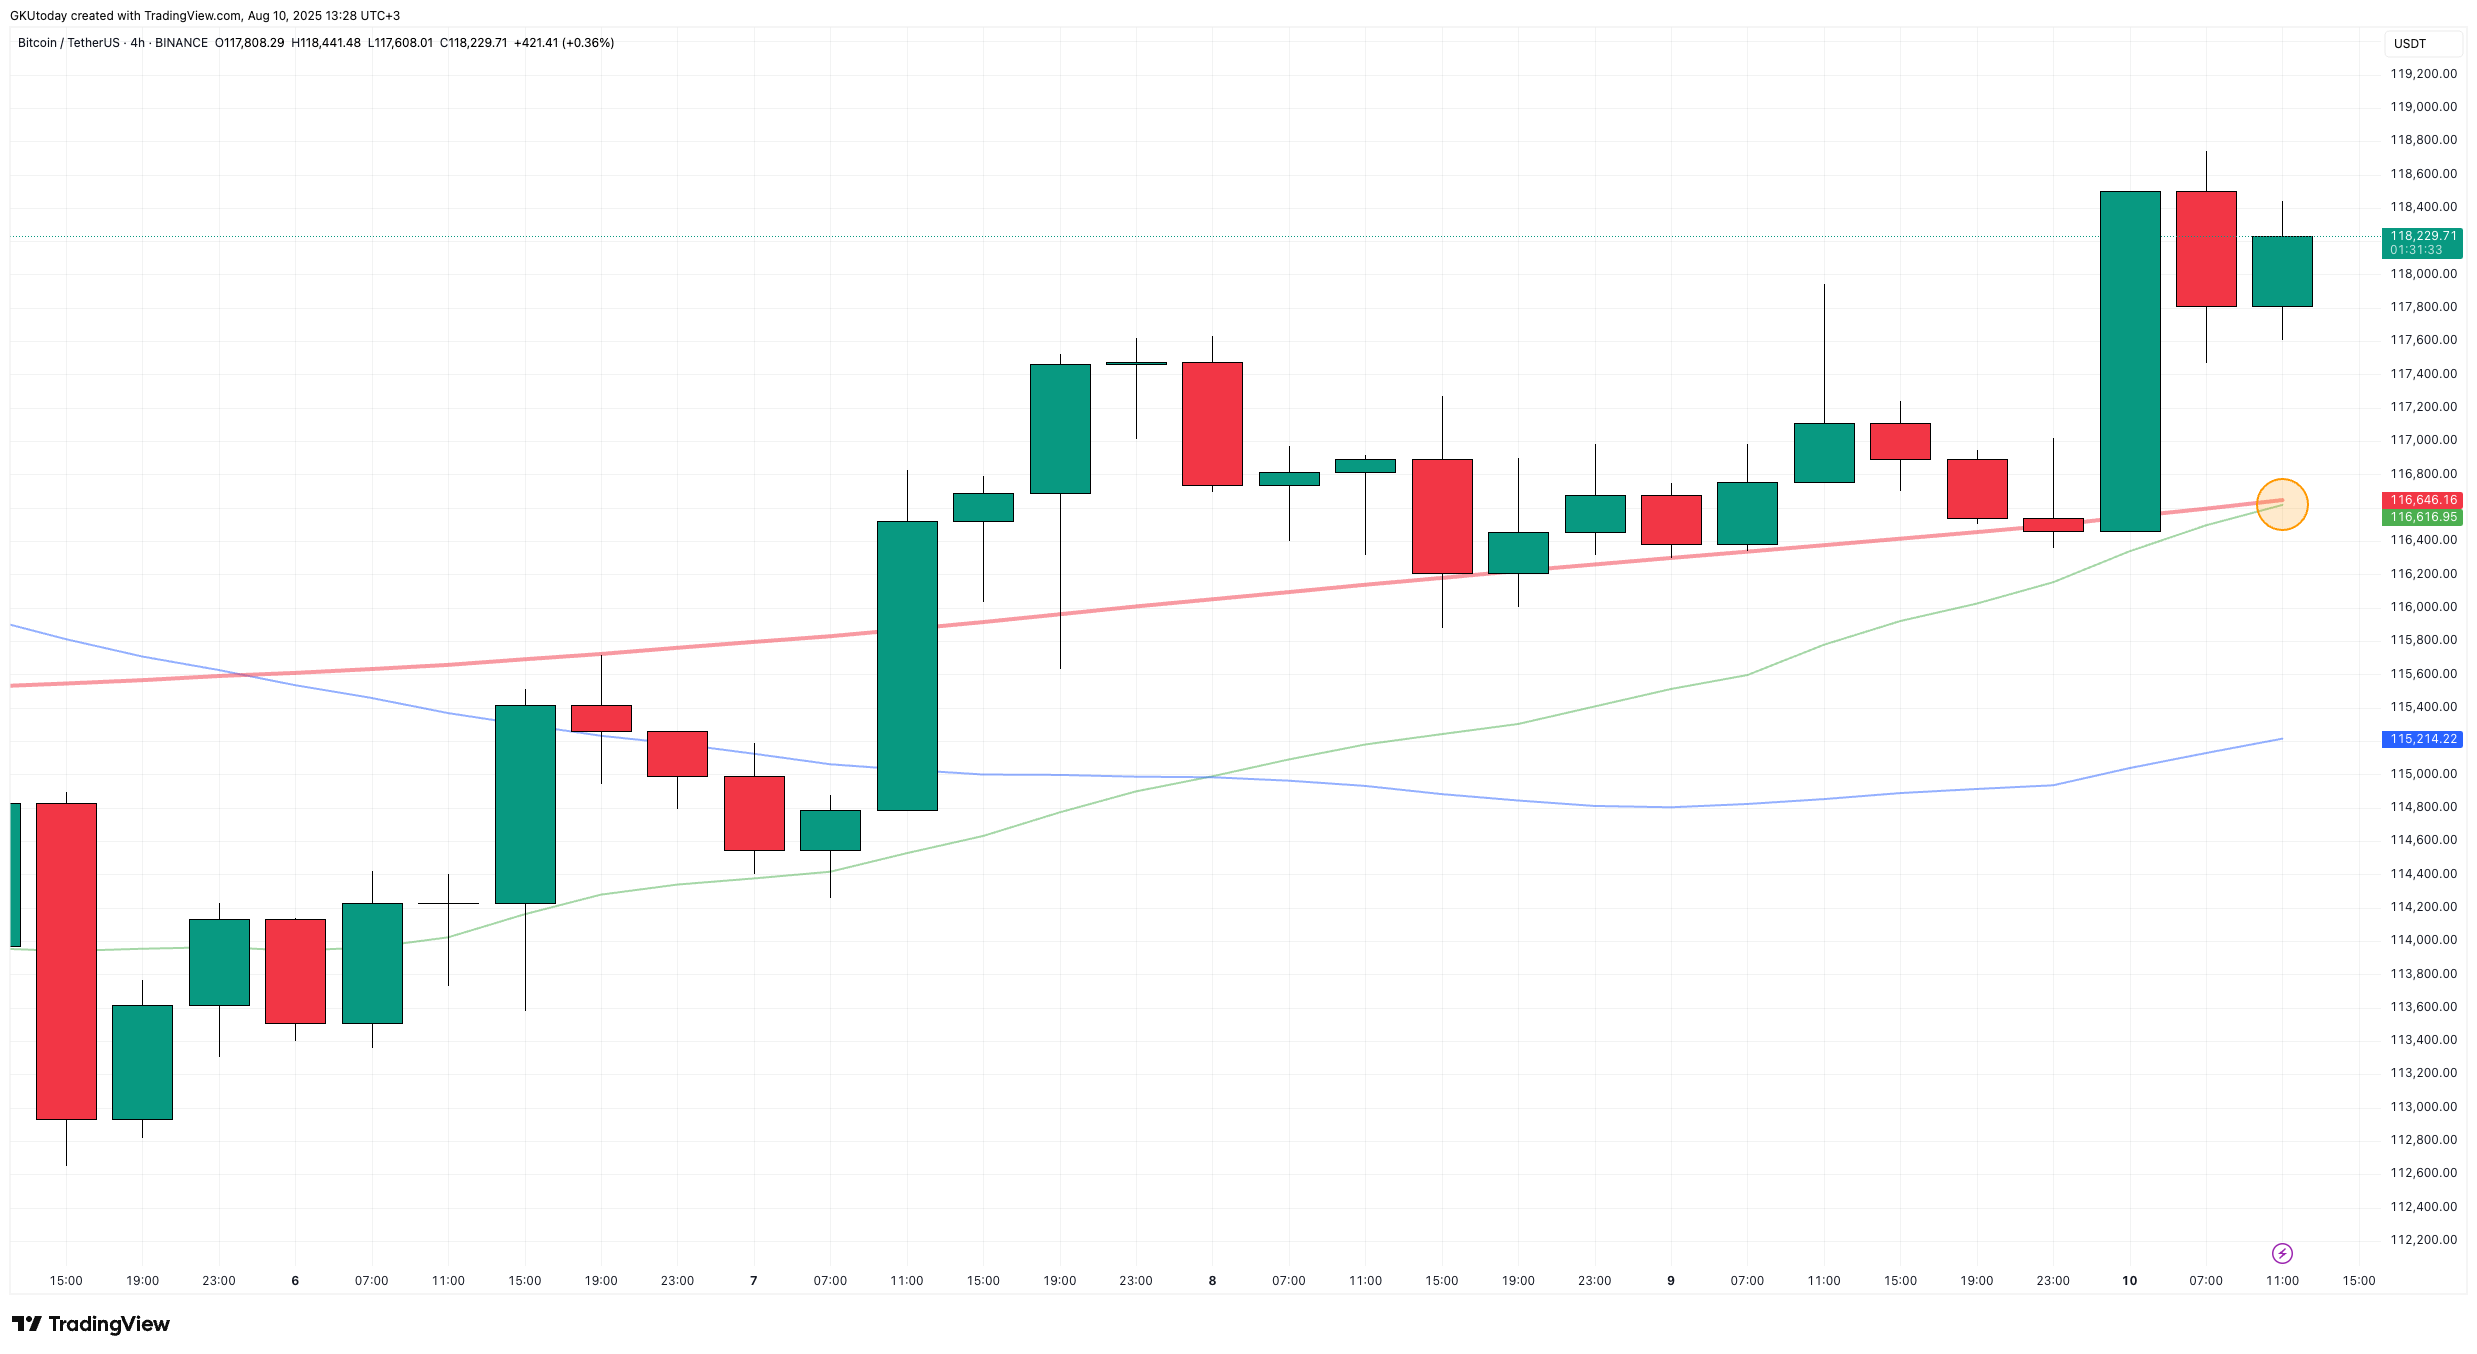
Bitcoin’s 4-hour chart is about to undergo a technical shift, which doesn’t happen very often. The short-term 23-period moving average, shown in green, has been climbing steadily toward the red 200-period line for a few days, and now the gap between them is so narrow it is almost guaranteed they’ll meet within the next couple of candles.
If you are into charts, that meeting point — the so-called golden cross — is often seen as a sign that the market is biased to go “north.”
What makes the setup stand out this time is the backdrop. Just yesterday, BTC went up from around $116,600 to almost $118,600 in one go, breaking out of a ceiling the market had been stuck under for most of the week.
On a 4-hour chart, a crossover like this isn’t usually a sure sign of what’s to come, but it can be a sign that buying pressure is starting to outweigh selling.
What’s next for BTC price?
If Bitcoin can stay above the $117,500–$118,000 range through the weekend, it will probably cross by Monday, which could lead to a test of the $119,000 and $120,000 levels. Those are the final hurdles before hitting all-time highs.
There’s also a technical cushion forming right where the averages are meeting, near $116,400. If the market dips, that area could be a good place to have another go at going higher, especially as there’s less liquidity on the weekend, which can make sharp moves even sharper.
You Might Also Like

The next 48 hours are more about seeing if the market has the strength to turn it into the first step of something bigger when the new week begins, rather than guessing if a golden cross will happen.