Bitcoin Magazine
Bitcoin Price Surges $30,000 in 30 Days! What’s Next?
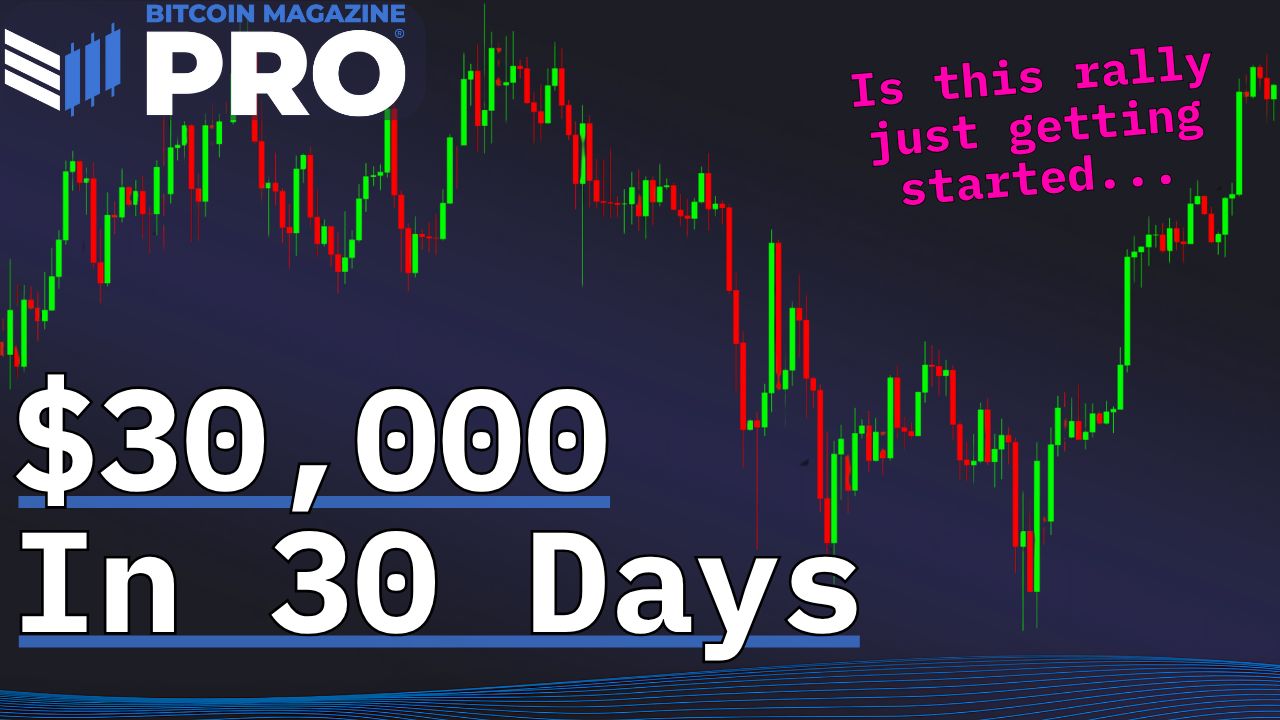
The Bitcoin price has recently surged $30,000 in just one month, signaling a strong return of the bull market. However, as excitement builds, it’s essential to take a step back and assess whether this rally is sustainable or if we might be getting ahead of ourselves. Let’s break down the current situation and what it means for investors.
Key Takeaways
- Bitcoin’s price has jumped from around $75,000 to nearly $106,000 in a month.
- Indicators suggest a potential cooling off period may be necessary.
- Historical data shows that rapid price increases often lead to corrections.
- Monitoring key metrics can help gauge market sentiment and future price movements.
Recent Bitcoin Price Action
Recent Bitcoin price action has been nothing short of spectacular. In just about 30 days, it rallied from approximately $75,000 to around $106,000. This kind of movement is exciting, especially after a long period of sideways trading and downward trends. The market seems to be buzzing with optimism, but we need to be cautious.
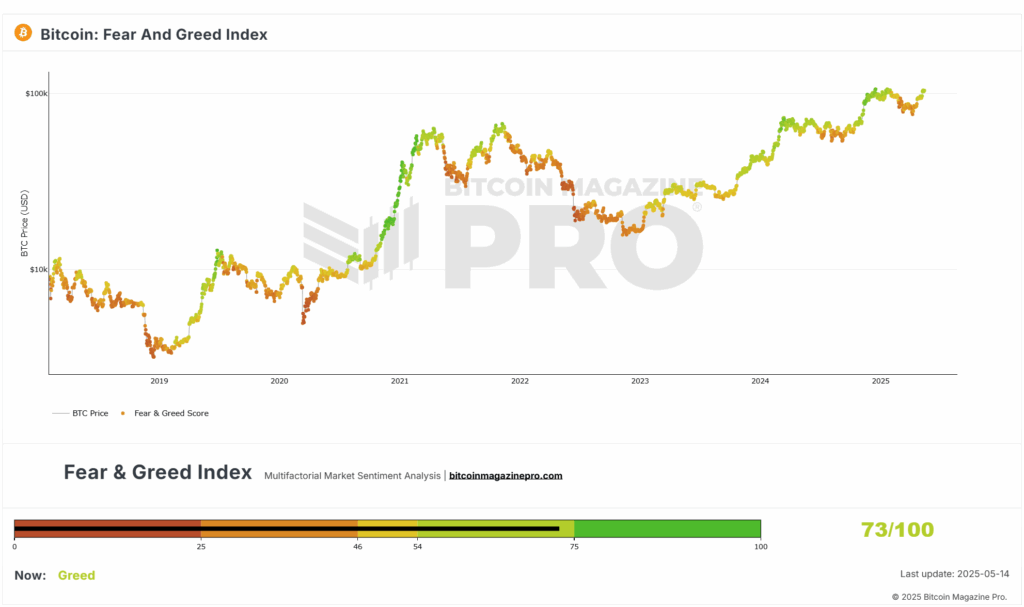
The Bitcoin Fear and Greed Index
One of the first indicators to look at is the Fear and Greed Index, which currently sits at 70. This level indicates a healthy amount of greed in the market, but it also raises a red flag. When sentiment is overly positive, it can often lead to a pullback.
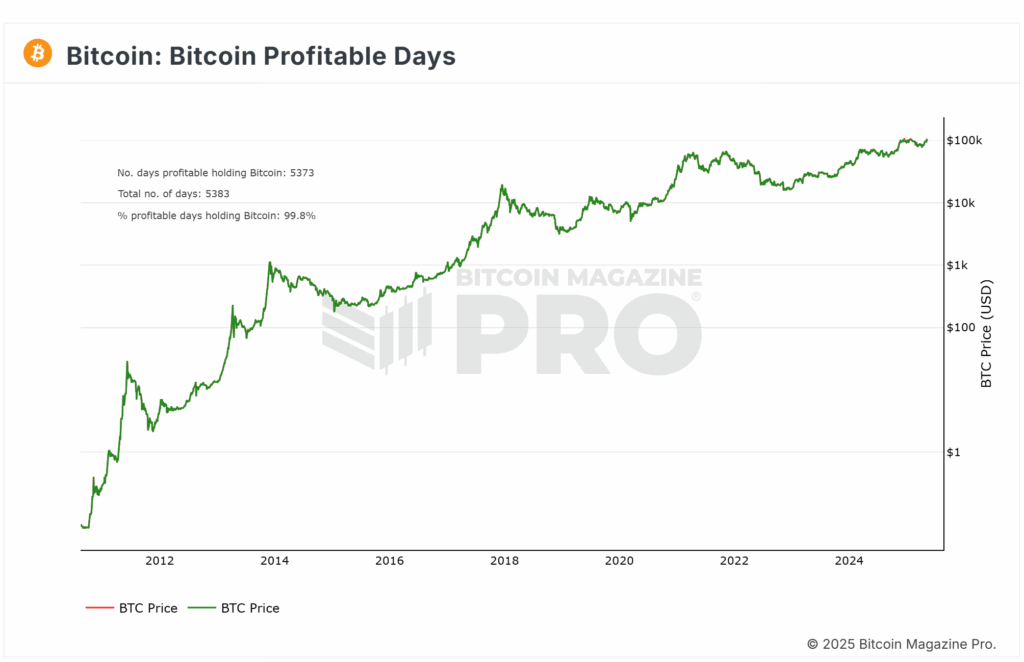
Bitcoin Profitable Days Chart
Another encouraging sign is the Bitcoin Profitable Days Chart, showing that 99.7% of days holding Bitcoin are now profitable. This is a strong indicator of market health, but it also suggests that many investors are sitting on gains, which could lead to profit-taking if prices start to dip.
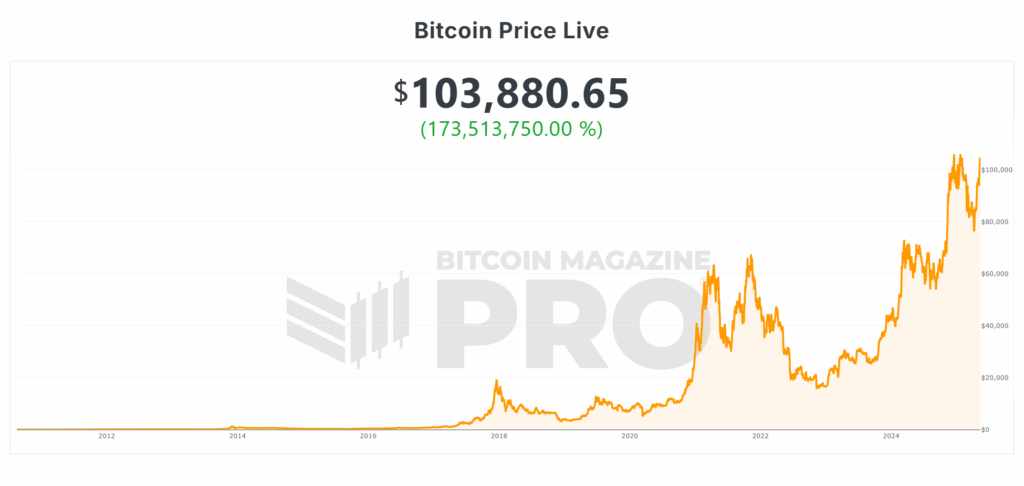
Bitcoin Historical Context
To put this rally into perspective, we need to look at how long it took the Bitcoin price to first reach $30,000. It took over 11 years to get there, but now we’ve seen a similar price increase in just a month. This rapid rise can often lead to a correction, as markets tend to overextend themselves.
Bitcoin MVRV Z-Score
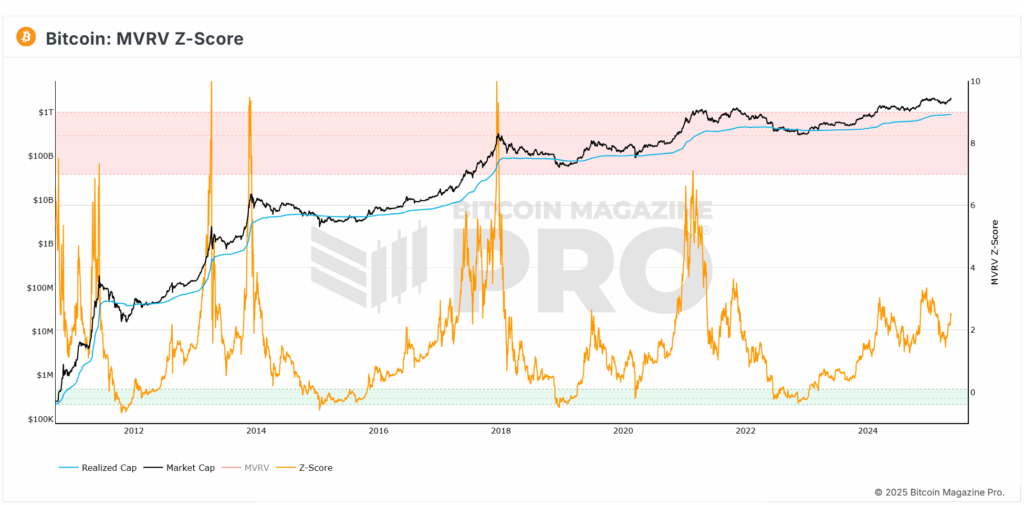
The MVRV Z-Score is another critical metric to consider. This score helps us understand whether Bitcoin is overvalued or undervalued based on historical data. Currently, we are approaching a key level that has historically indicated a potential pullback. If we see a rejection at this level, it could signal a cooling off period.
Bitcoin Active Address Sentiment
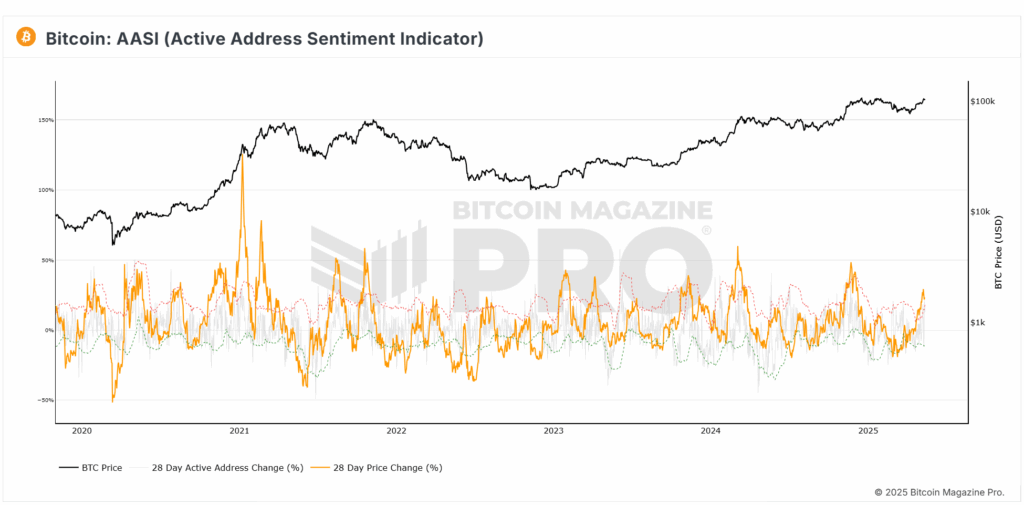
Looking at the Active Address Sentiment Indicator, we can see that when Bitcoin’s price rises significantly without a corresponding increase in active users, it often leads to unsustainable price levels. If we see a surge in price but not in active addresses, it could indicate that the rally is not backed by strong fundamentals.
Bitcoin Advanced NVT Ratio
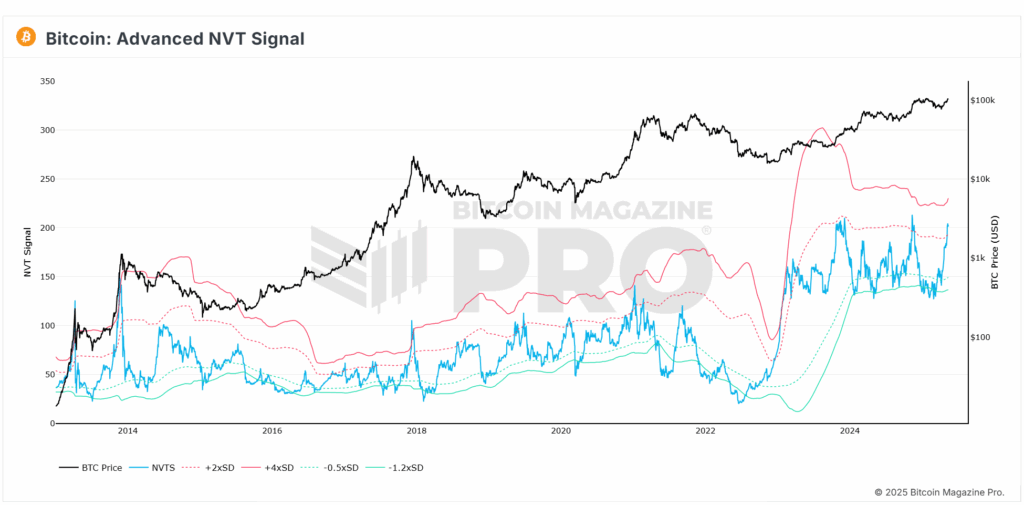
The Advanced NVT Ratio also shows similar trends. When this ratio rises above a certain level, it suggests that the market may be overextended. Historically, this has been a signal to be cautious about entering new positions or making large investments.
Technical Resistance Levels
From a technical analysis standpoint, we need to keep an eye on key resistance levels. The recent price action has touched a level where sellers have previously stepped in, leading to retracements. If Bitcoin can hold above $100,000 and turn it into support, that would be a positive sign for future growth.
While the current bullish sentiment is exciting, it’s essential to remember that a slight pullback could be healthy for the market. A cooling off period allows for a reset in expectations and can help new capital flow in without the market becoming too overextended.
Bitcoin Macro Perspective
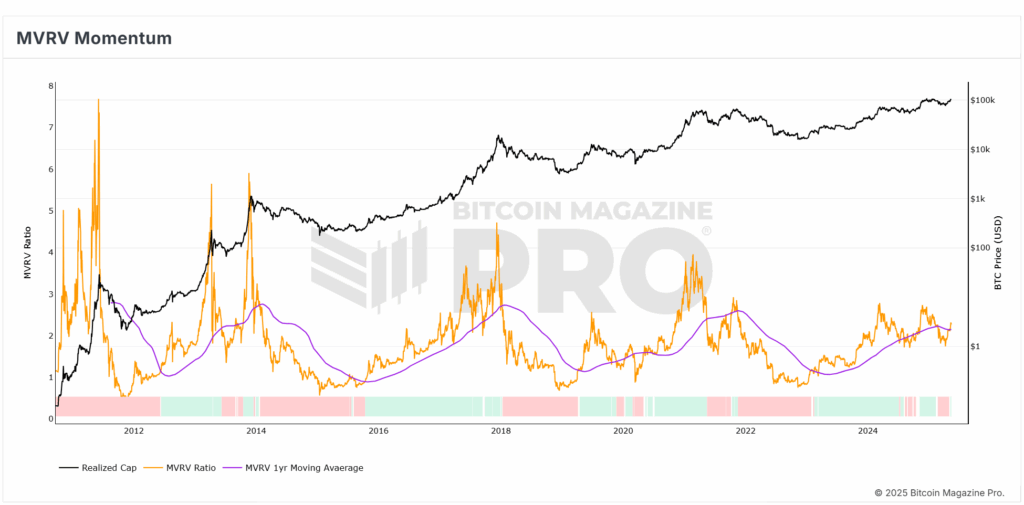
Despite the short-term concerns, the macro outlook for Bitcoin remains strong. The MVRV Momentum Indicator shows that we have reclaimed a significant moving average, which historically indicates the start of bullish market conditions. This suggests that while we may see some short-term volatility, the long-term trend is still upward.
Conclusion
In summary, the recent Bitcoin price rally is impressive, but we need to be cautious. The data suggests that while the market is strong, it may be due for a correction. Investors should focus on the data and avoid getting swept up in the excitement. A healthy pullback could set the stage for even greater gains in the future.
As always, keep an eye on the metrics and be prepared for whatever the market throws your way. Stay informed, and don’t let emotions drive your investment decisions.
For more deep-dive research, technical indicators, real-time market alerts, and access to a growing community of analysts, visit BitcoinMagazinePro.com.

Disclaimer: This article is for informational purposes only and should not be considered financial advice. Always do your own research before making any investment decisions.
This post Bitcoin Price Surges $30,000 in 30 Days! What’s Next? first appeared on Bitcoin Magazine and is written by Mark Mason.
