
Bitcoin remains in a tight consolidation phase, trading between $115K and $122K for over two weeks as it hovers just below its all-time highs. The sideways price action reflects a market in wait mode, with neither bulls nor bears taking full control. While some traders expect a breakout toward new highs, others warn of a possible cooldown if momentum fades. Still, sentiment leans slightly bullish as key demand zones continue to hold and price action shows resilience.
According to CryptoQuant, Bitcoin’s 3-month realized volatility has dropped to 70%, signaling a period of rare calm. This reading is near historical minimums and just above the 62% level recorded on September 23, 2023, when BTC was trading at $26,000. Volatility compression at this scale often precedes explosive moves, making the coming days critical for defining Bitcoin’s short-term trend.
Analysts are closely watching for a breakout above $122K or a breakdown below $115K to confirm direction. Until then, the market remains in a tight standoff, supported by strong on-chain demand and cautious optimism. Whether Bitcoin continues higher or faces another correction may depend on how it behaves within this increasingly narrow range in the days ahead.
Bitcoin Volatility Drops as Big Money Slows the Market
Top analyst Axel Adler recently shared insights highlighting how Bitcoin’s behavior has shifted in this cycle due to the growing presence of institutional capital. According to Adler, the maximum realized volatility so far in this cycle is just 143%—a stark contrast to previous cycles, where it reached as high as 236%. This reduction in volatility reflects how Bitcoin has matured as an asset, with large-scale investors smoothing out extreme price swings that once defined crypto bull runs.
Adler interprets the current level as a reset moment, not a sign of exhaustion. Historically, such low volatility phases have acted as breathers before the next leg up in a major trend. If this pattern holds, Bitcoin could be preparing for another rally once this consolidation phase ends.
At the same time, capital rotation is beginning to play a bigger role. Ethereum is currently outperforming Bitcoin, and several altcoins are gaining traction, signaling a potential shift in market leadership. Still, Bitcoin remains the anchor of the market, and any decisive move—up or down—will likely set the tone for the broader crypto space.
For now, Bitcoin’s consolidation and suppressed volatility may be exactly what the market needs before reigniting momentum. Whether it leads or follows the next breakout, historical trends and on-chain data suggest BTC’s rally might not be over yet.
BTC Holds Above Key Support
Bitcoin remains range-bound between $115,724 and $122,077, as shown in the 4-hour chart. Price is currently trading around $118,513, with short-term momentum stabilizing just above the 50 and 100 simple moving averages (SMAs), both near $118,100. These moving averages are now acting as dynamic support, reinforcing bullish structure despite the absence of a breakout.
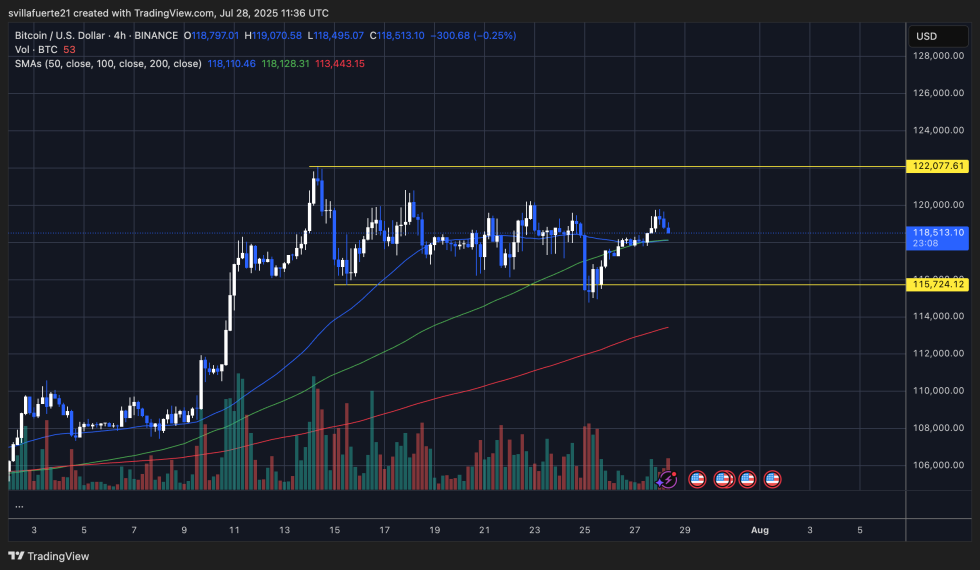
Recent price action shows another failed attempt to breach the upper resistance at $122,000, leading to a slight pullback. However, the dip was quickly absorbed near the 50 SMA, confirming continued demand within the range. Volume remains muted, suggesting that market participants are waiting for a decisive move before committing capital.
The support at $115,724 continues to serve as the key lower boundary of the consolidation zone. If this level holds, bulls have a strong base to launch another breakout attempt. But if it breaks, the next significant support lies near the 200 SMA at $113,443.
Featured image from Dall-E, chart from TradingView