
Bitcoin is holding strong above the $108,000 level and continues to push toward a breakout above its all-time high near $112,000. Price action remains firmly bullish, with little to no signs of weakness as buyers maintain control across major timeframes. After weeks of consolidation and steady gains, BTC now appears poised for a potential move into uncharted territory.
Supporting this bullish momentum, on-chain data from CryptoQuant reveals that the unrealized profit indicator for Short-Term Holders—those holding coins for 1 to 3 months—currently sits at 27%. This metric helps gauge how much profit short-term investors are sitting on, and historically, it has provided key signals during major market moves.
Over the past four years, when this indicator surpassed 40%, it often triggered a wave of selling from this cohort, leading to increased downward pressure on the BTC price. With the metric still well below that critical threshold, the market may have room to climb before short-term holders begin locking in profits at scale.
Bitcoin Enters Pivotal Week As Analysts Eye Breakout Toward $120K
Bitcoin is heading into a crucial week as price action hovers near all-time highs and analysts forecast a breakout that could send BTC soaring to $120,000. After weeks of steady gains and bullish consolidation above the $108,000 level, momentum is building. The market is increasingly confident that a clean push above the $112K resistance could unlock the next leg of the cycle.
This comes as global markets face heightened uncertainty. With persistent macroeconomic instability, rising geopolitical tensions, and diverging monetary policy expectations, Bitcoin appears to be thriving in volatility. Its non-sovereign, digital nature continues to attract capital during times of financial stress, acting as both a hedge and a high-beta growth asset.
Top analyst Axel Adler shared compelling on-chain data highlighting where the market currently stands. According to CryptoQuant, the Net Unrealized Profit/Loss (NUPL) for Short-Term Holders is now at 27%. Historically, this cohort begins taking profits once the metric crosses 40%, often triggering sell pressure and temporary tops.
Adler’s forecast assumes a steady increase of 0.818 percentage points per day, putting the 40% threshold roughly 16 days away—on or around June 11, 2025. At that point, BTC could be trading near $162,000 if the trend continues uninterrupted.
He cautions that the forecast is based on linear extrapolation and does not account for potential market shocks, “black swan” events, or political headlines, such as a sudden policy shift or viral tweet from US President Donald Trump.
Bulls Defend Post-Breakout Levels
Bitcoin is trading at $109,844 and holding strong above the key breakout zone after reaching a new all-time high near $112,000. The daily chart shows BTC maintaining a bullish structure, with price well above the 34 EMA ($101,469) and all major moving averages. The $103,600 level, marked in yellow, served as a long-term resistance earlier in the cycle and has now flipped into support—a textbook breakout-retest structure.
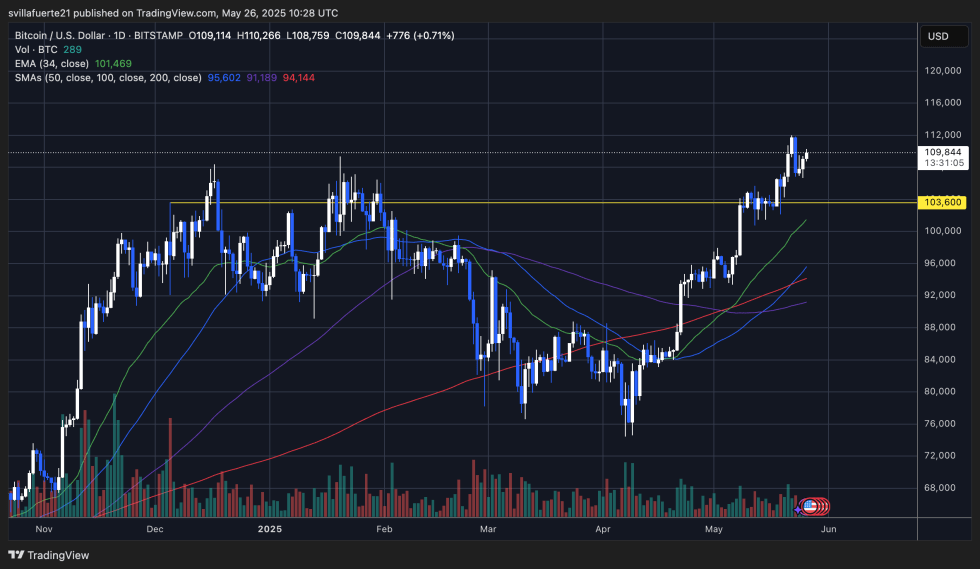
Volume has remained relatively steady during this consolidation, and the recent candles suggest healthy digestion of gains rather than exhaustion. BTC continues to print higher lows, signaling that buyers are stepping in on each pullback. As long as the price remains above the $103K–$105K region, the broader trend remains intact.
The next critical resistance lies just above $112,000. A daily close above this level would likely confirm continuation and open the door to the $120,000–$125,000 range. Momentum is still on the bulls’ side, and the structure points to a market preparing for further upside.
Featured image from Dall-E, chart from TradingView