- S2F reversion model gauges Bitcoin price deviations, offering insights for profit-taking opportunities.
- Thresholds like 2.5 and 3.0 help traders balance risk and reward during market highs.
Bitcoin’s [BTC] recent surge to a new ATH has sparked renewed interest in key market metrics, especially in the Stock-to-Flow (S2F) reversion model.
The S2F reversion metric measures Bitcoin’s price deviations from its expected value, offering valuable insights for investors looking to time market entries and exits.
Traders are increasingly relying on this model to gauge market sentiment and pinpoint optimal profit-taking opportunities.
Understanding the S2F reversion model
Bitcoin’s key metric, the Stock-to-Flow (S2F) reversion model, evaluates Bitcoin’s price deviations from its expected value based on the widely known Stock-to-Flow model.
This model considers Bitcoin’s scarcity, linking its supply issuance rate to its market value. The S2F reversion metric quantifies how far the actual price diverges from the predicted price, offering a data-driven perspective on market trends.
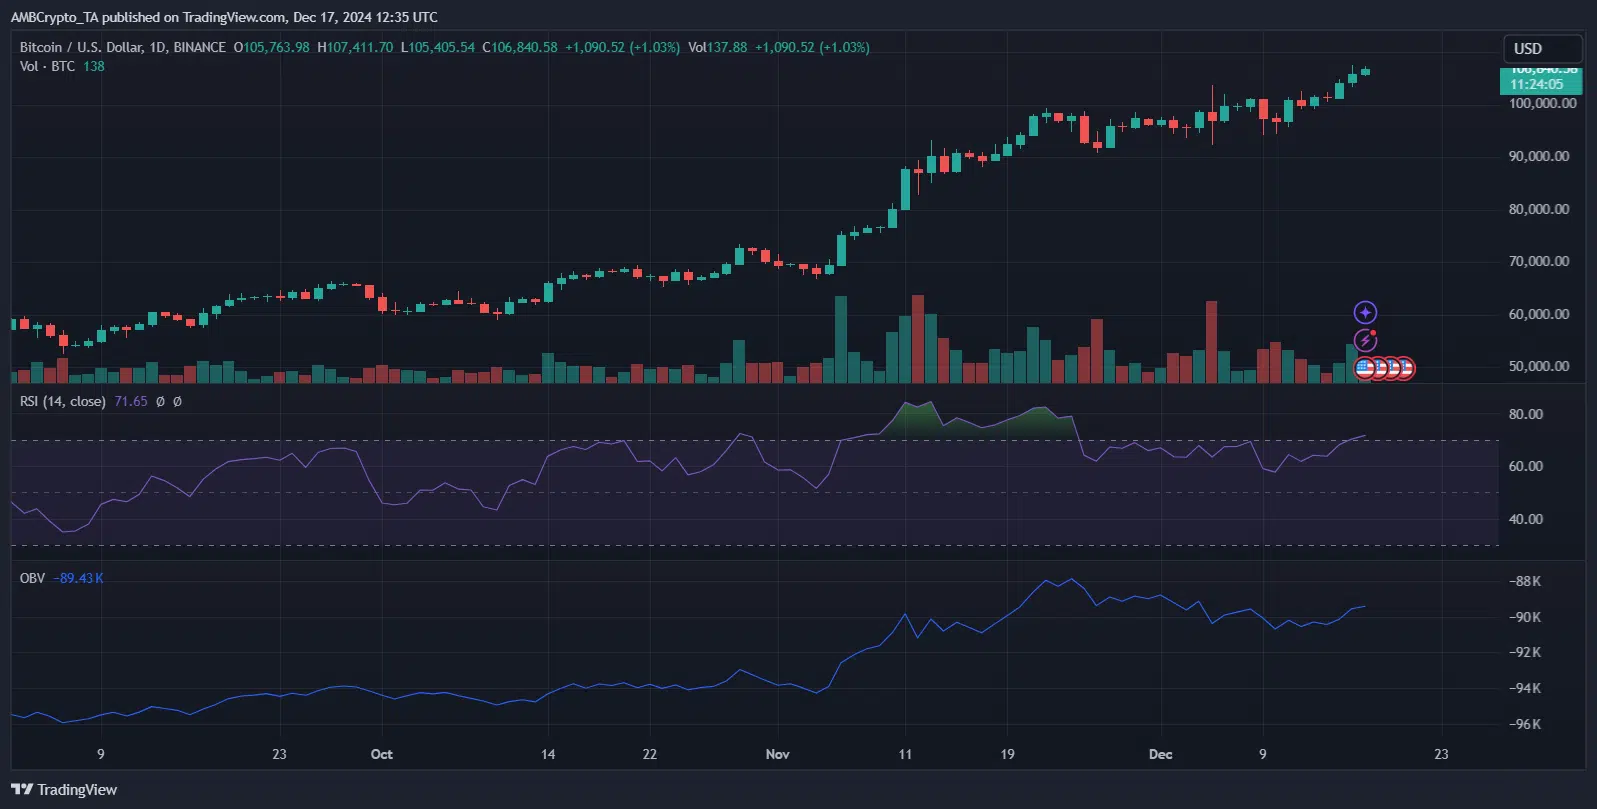
Understanding this metric is critical, particularly during pivotal market movements like Bitcoin’s recent ATH of $106,352.
By identifying price overextensions or undervaluations, the S2F reversion metric equips investors with a systematic tool for assessing market sentiment.
This helps traders not only to spot profitable entry points, but also to minimize risks during volatile periods. Its structured approach makes it an indispensable asset for timing market decisions effectively.
Bitcoin’s key metric: The 2.5 and 3.0 thresholds in S2F
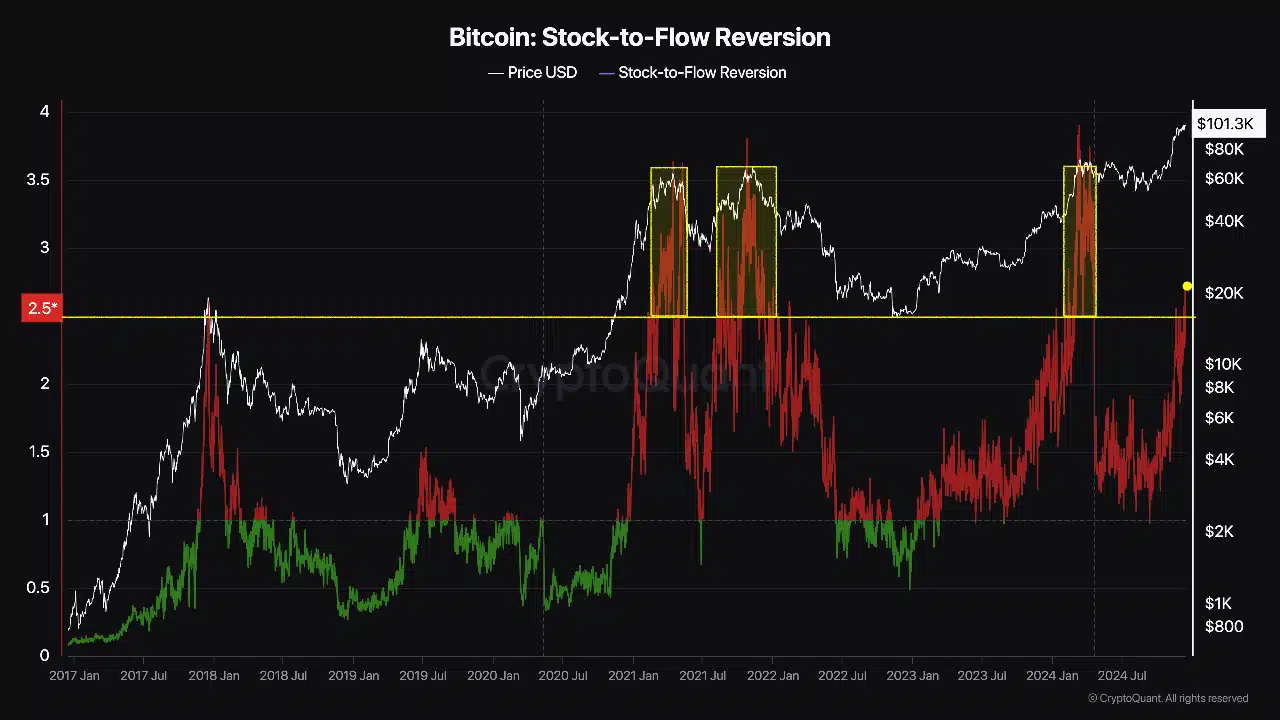
CryptoQuant analyst Darkfost highlights the importance of specific S2F reversion thresholds — 2.5 and 3.0 — in optimizing Bitcoin profit-taking strategies.
A value above 2.5 historically signals moderate profit-taking opportunities, reflecting growing market enthusiasm without excessive risk.
Conversely, a value exceeding 3.0 often indicates market overheating, suggesting it’s time for more substantial profit-taking to avoid potential downturns.


Source: Cryptoquant
Darkfost recommends a two-step approach: secure smaller gains at 2.5 and larger profits at 3. This strategy allows traders to balance risk and reward, leveraging historical data to make informed decisions.
For example, as Bitcoin surged to $106,352, these thresholds provide clarity on when to act amidst market euphoria. Employing this model ensures traders don’t miss profit opportunities while staying cautious during speculative highs.
Read Bitcoin’s [BTC] Price Prediction 2024–2025

