- Bitcoin’s pullback over the past month has reset speculative activity.
- The sentiment was slightly greedy and the market was likely ready for another sustained period of uptrend.
Bitcoin [BTC] was trading at $98k after the recent correction from $108k to $92.5k. This saw the Bitcoin Fear and Greed value drop to neutral, from where they are climbing higher now.
The sentiment across the crypto market is mainly dictated by Bitcoin’s trends. There can be dozens of outliers that trend against BTC or massively outperform the leading crypto. Yet, these are usually the exceptions and not the norm, especially among large-cap coins.
Overheated signals- have they receded?


Source: CoinMarketCap
The CoinMarketCap Crypto Fear and Greed Index had hovered above 80 from the 11th of November to the 12th of December. This month-long bullish sentiment saw BTC gain 24.6%. Since then, the greedy sentiment has fallen and reached 54 on the 23rd of December.
As a rule of thumb, it is a good idea to buy when the sentiment is fearful and sell when greedy. However, during strong trends, as we saw over the past month, greedy readings can be accompanied by strong market-wide gains.


Source: Coinglass
Another gauge of the Bitcoin Fear and Greed sentiment was through the Open Interest data. The chart above shows that BTC OI has dropped from $68.13 billion to $60.21 billion in the past nine days.
It was a sign that speculators were wary of going long, and reflected hesitancy from bullish futures market participants.
Accumulation trends have restarted after the struggle under $100k


Source: Santiment
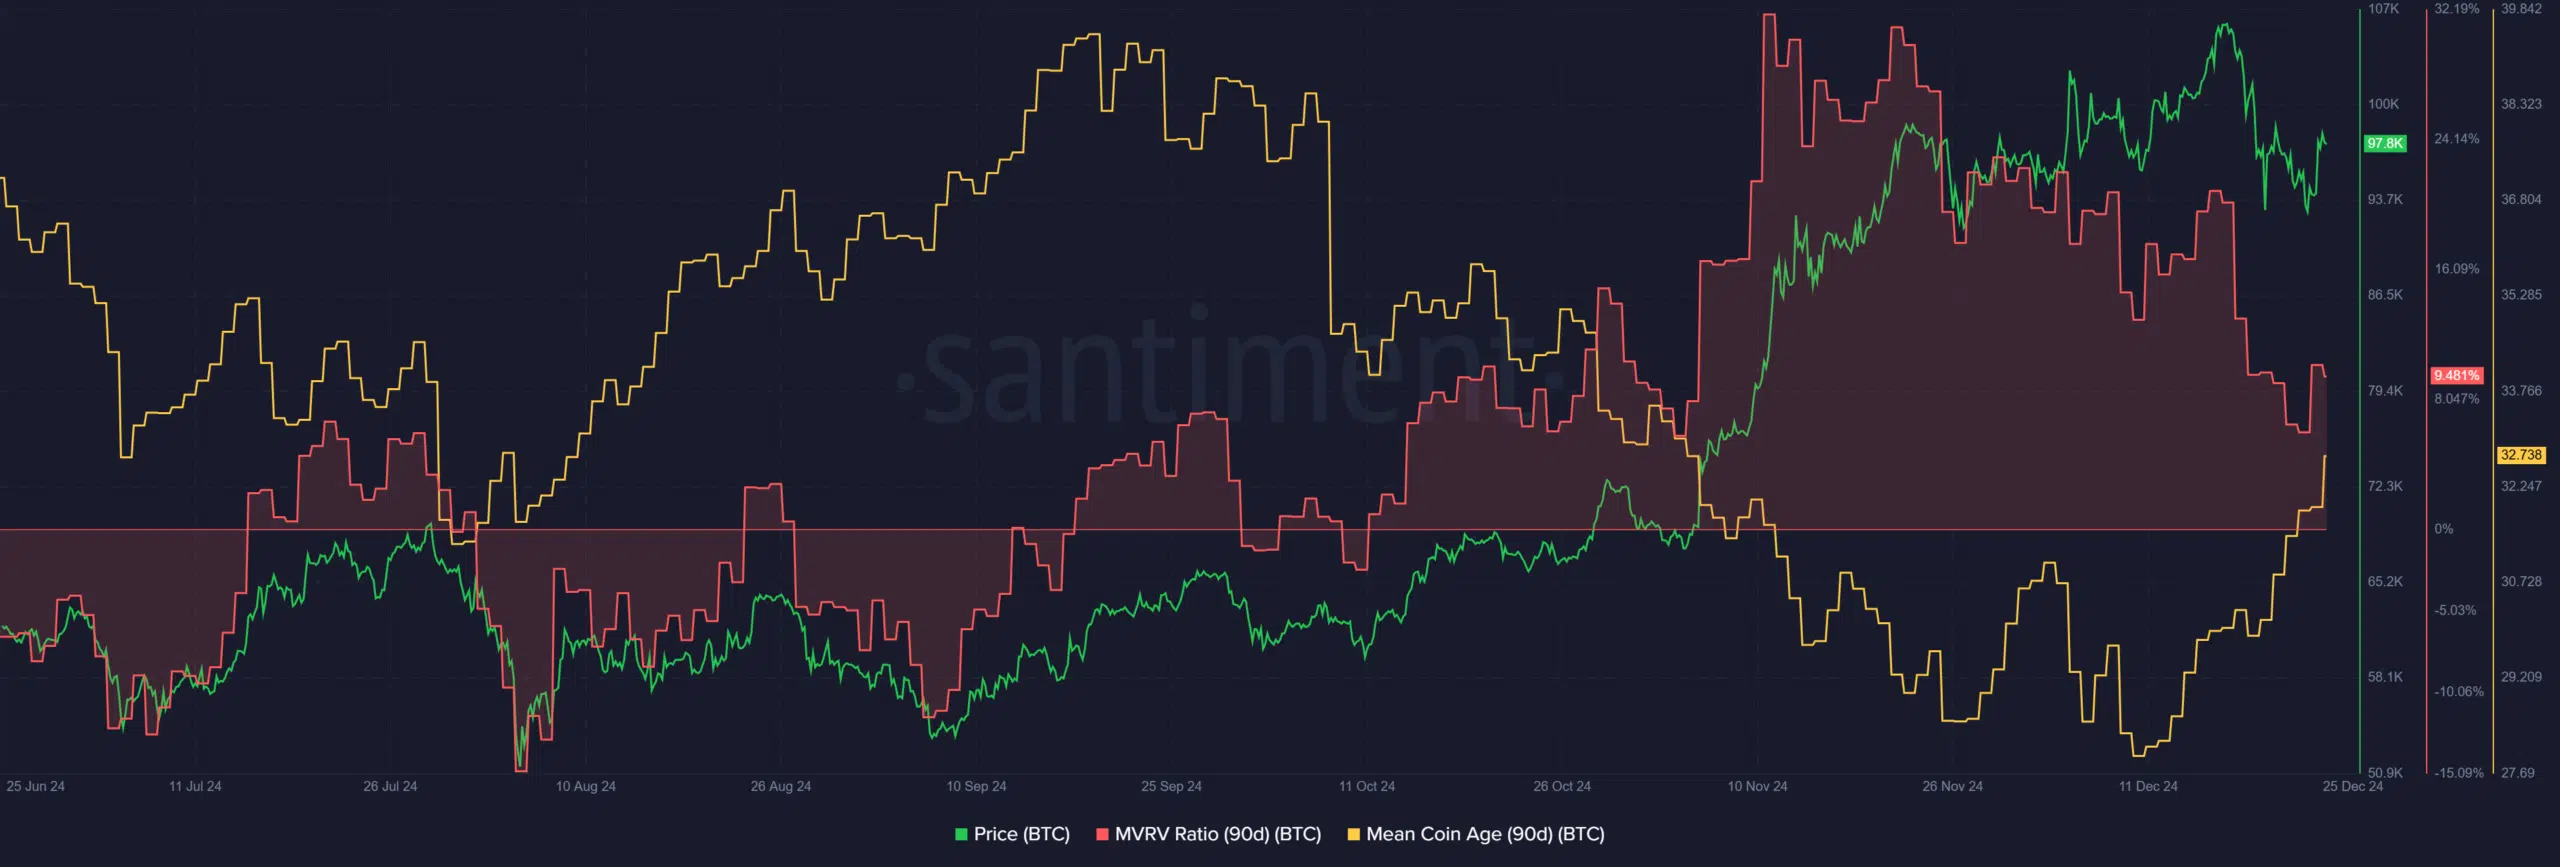
While the sentiment across the market cooled down due to the recent sell-off, there were some positives for BTC. The mean coin age had been in a downtrend from late September to mid-December.
This trend has begun to reverse over the past ten days, showing accumulation and was a strong bullish sign.
The 90-day MVRV ratio was at 9.46%, showing that on average, holders within this time window were at a decent profit. Yet, it too has been trending downward for nearly six weeks.
Read Bitcoin’s [BTC] Price Prediction 2024-25
This was a sign that selling pressure from short to medium-term holders’ profit-taking would likely have a minimal impact in the coming days.
Putting the clues together, the renewed accumulation and the sentiment reset were firm signals that Bitcoin is ready for its next sustained push beyond $100k.
