The Chainlink (LINK) price has increased since January 3, validating the support trend line of a long-term pattern.
The LINK price is approaching the top of a long-term range that has existed for 70 days.
Chainlink Approaches Range High
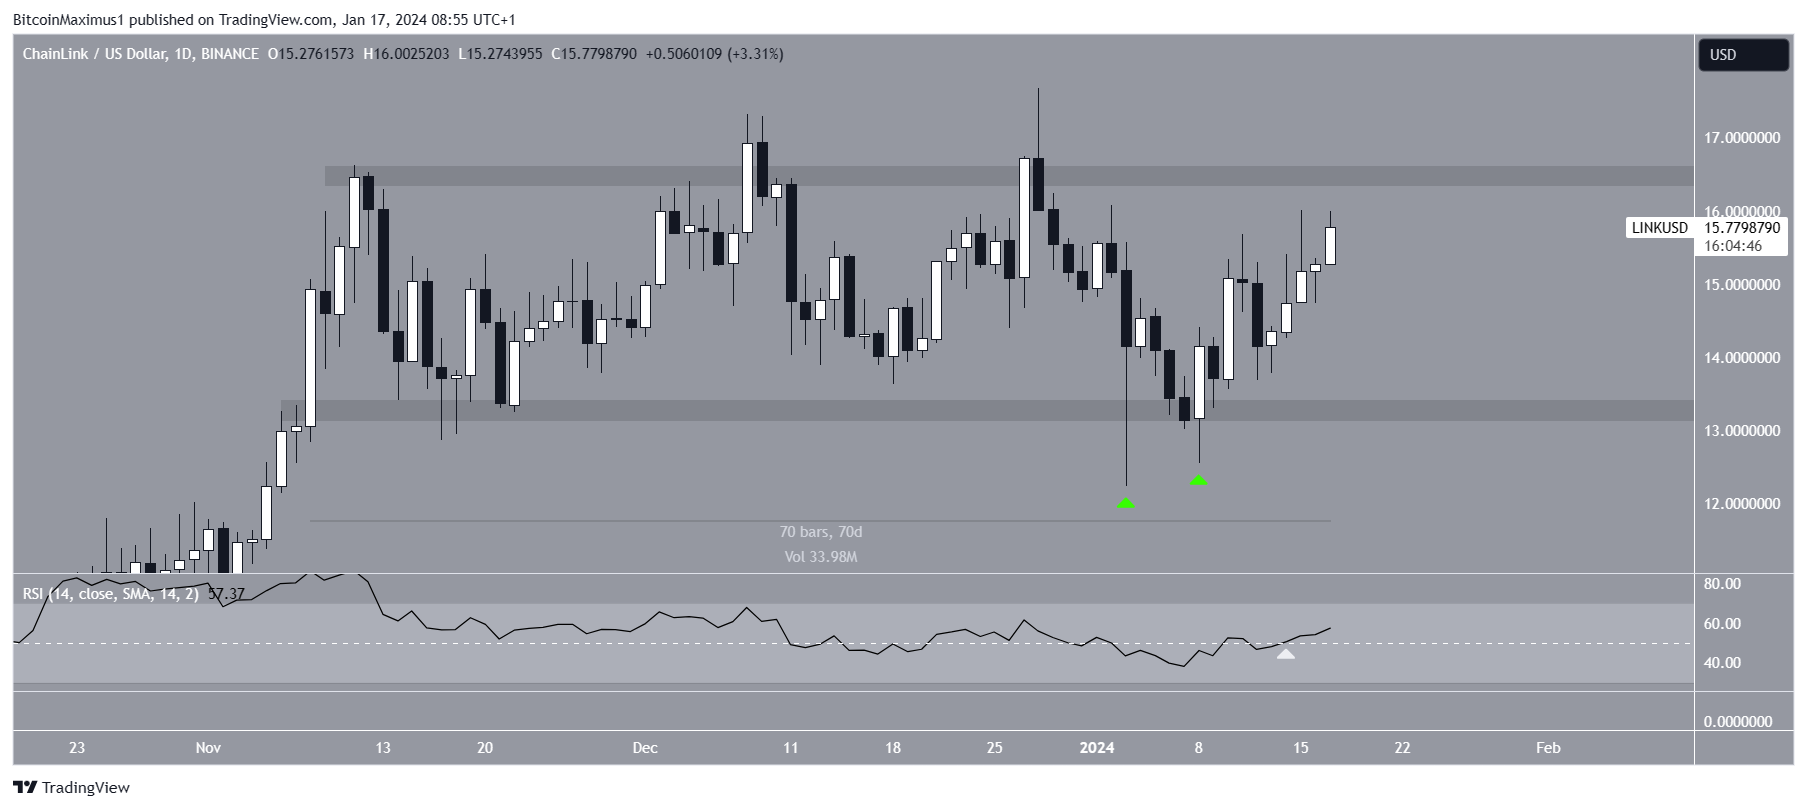
The daily time frame price action shows that LINK has increased since January 3, when it had fallen to a low of $12.24. The price created a higher low on January 8, which led to a bullish engulfing candlestick. It has increased at an accelerated rate since then.
The bounce also caused a reclaim of the range low in a horizontal range in place for 70 days. LINK now approaches the range high, which has yet to be reached this year.
Due to the upward movement, the Relative Strength Index (RSI) gives a positive reading.
When evaluating market conditions, traders use the RSI as a momentum indicator to determine whether a market is overbought or oversold and whether to accumulate or sell an asset.
If the RSI reading is above 50 and the trend is upward, bulls still have an advantage, but if the reading is below 50, the opposite is true.
The RSI increased above 50 (white icon) once the price bounced at the range low, a sign of a bullish trend.
Read More: How to Buy Chainlink With a Credit Card
What Do the Analysts Say?
Cryptocurrency traders and analysts on X are mostly bullish on the future LINK trend.
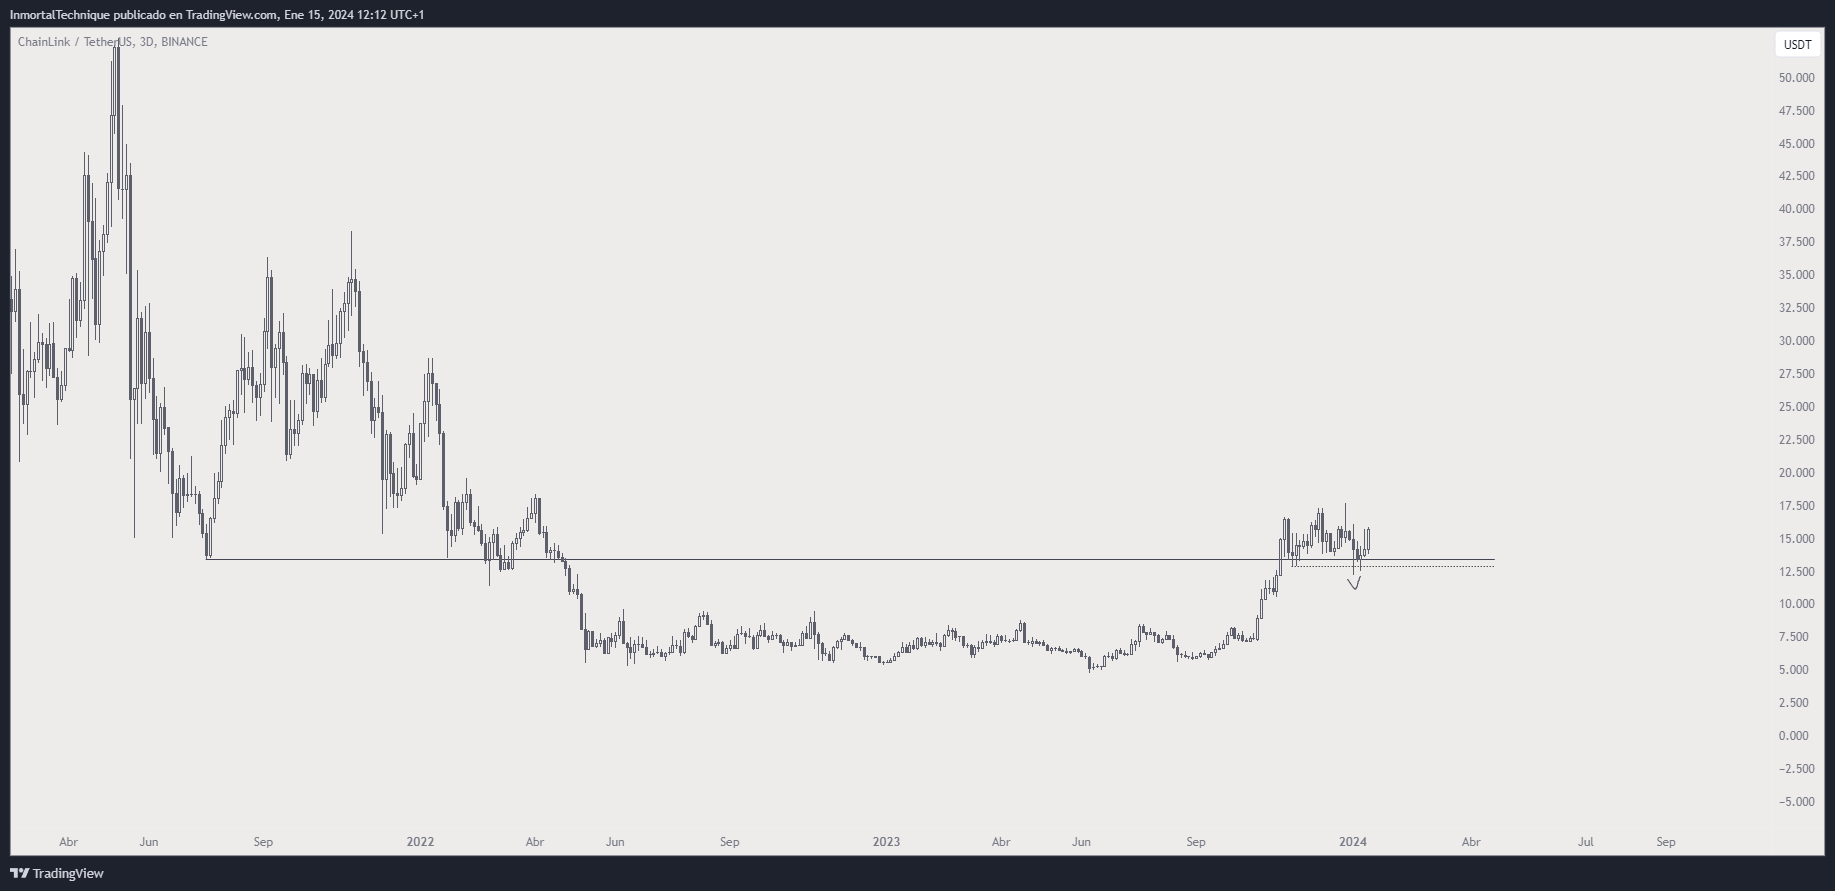
Inmortal says that LINK is his favorite coin for five reasons:
> +500 days accumulation
> Expansion
> S/R flip
> Re-accumulation
> Expansion

Quinten suggests that the price will reach $18 soon since it is currently reaccumulating. Finally, Altcoin Sherpa is less bullish than the others. The trader shows an accumulation range but suggests that the LINK price will continue consolidating before an eventual breakout.
Read More: What is Chainlink (LINK)?
LINK Price Prediction: Has the Correction Ended?
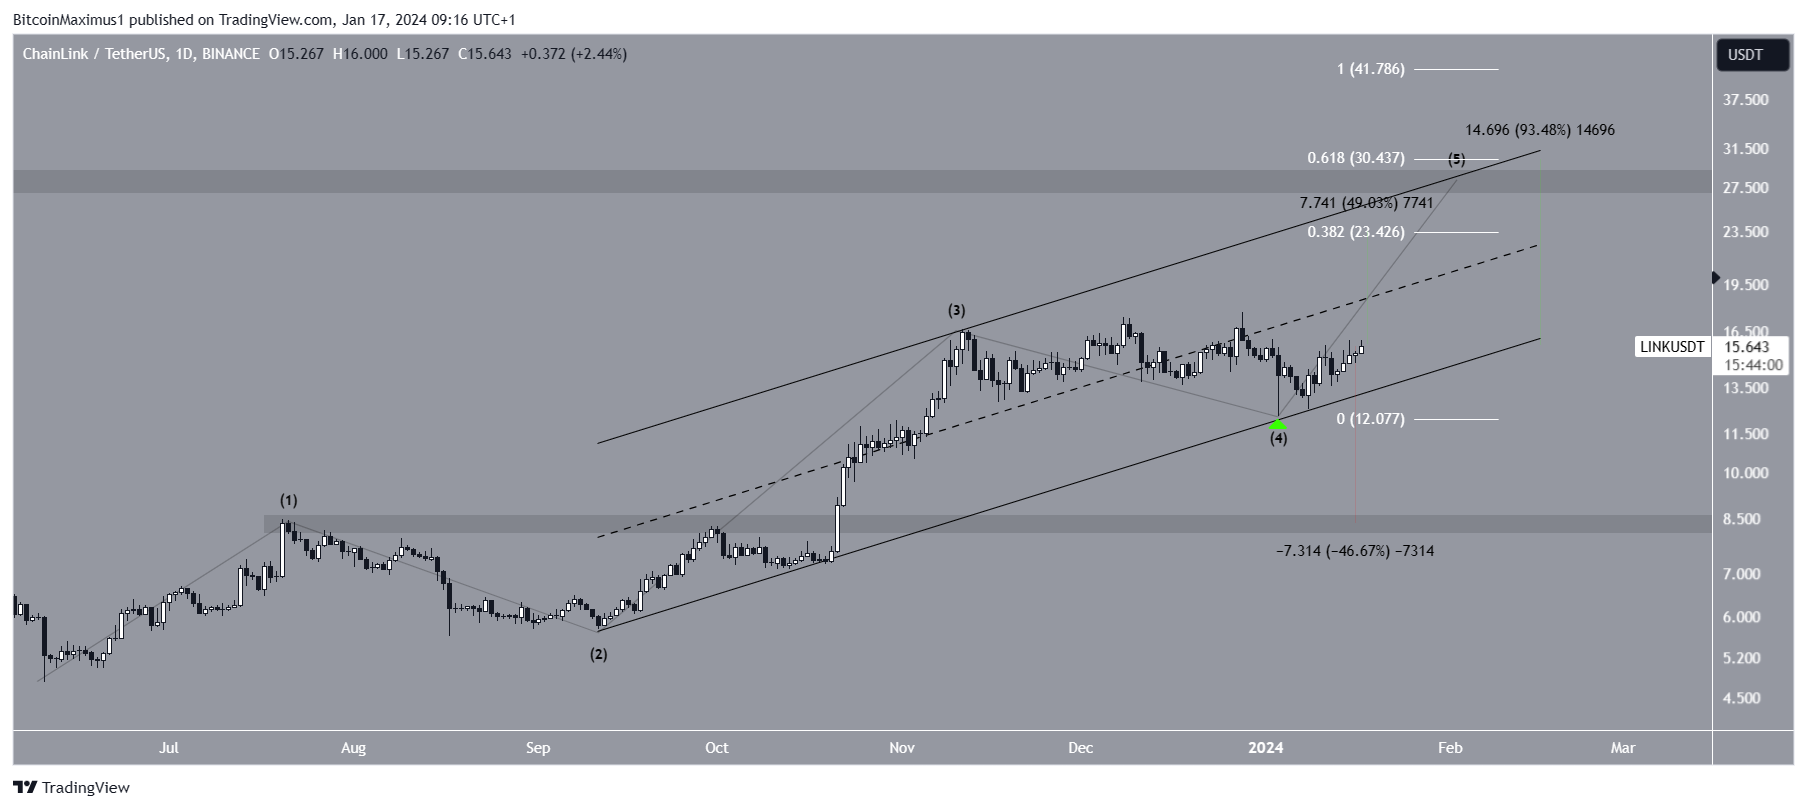
A look at the movement since June 2023 gives a bullish reading because of the LINK price action and wave count.
Technical analysts employ the Elliott Wave theory to identify recurring long-term price patterns and investor psychology, which helps them determine the direction of a trend.
The most likely wave count suggests that LINK started the fifth and final wave of an upward movement on January 3 (green icon). Most of the movement was contained inside an ascending parallel channel which the bounce validated.
If the count is correct, LINK will increase to $23.40 and possibly $30.40. The targets are found by extending wave five to 0.382 and 0.618 times the length of the other waves combined.
They represent increases of 50% and 95%, respectively. The second target would also reach the resistance trend line of the channel.

Despite the bullish LINK price prediction, a decrease below $12.20 will invalidate the count. Then, the price can fall 47% to the closest support at $8.30.
For BeInCrypto‘s latest crypto market analysis, click here
![]()
Coinbase
Coinbase” target=”_blank”>Explore →
![]()
KuCoin
KuCoin” target=”_blank”>Explore →
![]()
Metamask Portfolio
Metamask Portfolio” target=”_blank”>Explore →
![]()
Wirex App
Wirex App” target=”_blank”>Explore →
![]()
YouHodler
YouHodler” target=”_blank”>Explore →
![]()
Margex
Margex” target=”_blank”>Explore →
Explore more
The post Can Chainlink (LINK) Finally Reach $20 After 70-Day Consolidation? appeared first on BeInCrypto.
