
Join Our Telegram channel to stay up to date on breaking news coverage
Solana price is facing resistance after breaking out of an extended consolidation zone within the $127 area. SOL price is down a fraction of a percentage in the last 24 hours, despite a 10% surge in the last week, trading at $138.78 as of 01:18 a.m. EST.
This slight drop occurred just hours after Morgan Stanley filed a Form S-1 with the US Securities and Exchange Commission (SEC) for a Solana Trust.
Solana’s weekly surge comes amid a start of the year rally that saw Bitcoin price climb back above the $93,500 region.
However, a key historical pattern on the SOL 3-day chart suggests a potential recovery. Whenever Solana touches support around $120, it is followed by a sustained surge to recover any losses. Can the Solana token deliver on this sentiment?
Morgan Stanley Files For Solana ETF: Why This Could Be A Major Price Catalyst
Morgan Stanley, a Wall Street heavyweight, has filed a Form S-1 with the US SEC, seeking approval for a spot BTC exchange-traded fund (ETF) and a Solana trust, further advancing its ambitions in digital assets.
SHOCKER: Morgan Stanley just filed for a spot Bitcoin and Solana ETF. H/t @TheBlock__ pic.twitter.com/AmYLeDTJBy
— Eric Balchunas (@EricBalchunas) January 6, 2026
The Morgan Stanley Solana Trust is meant to track the price of Solana and allow investors gain exposure to SOL through traditional investment vehicles. This removes the need for direct custody of the token.
According to SoSoValue data, Solana funds have grown to more than $1 billion in total net assets, following cumulative net inflows of nearly $800 million and daily total inflows of $9.22 million.
Historically, ETF filings and approvals have played a critical role in boosting institutional participation, as seen with BTC sport ETFs.
Solana Price Analysis: Bullish Breakout In Focus
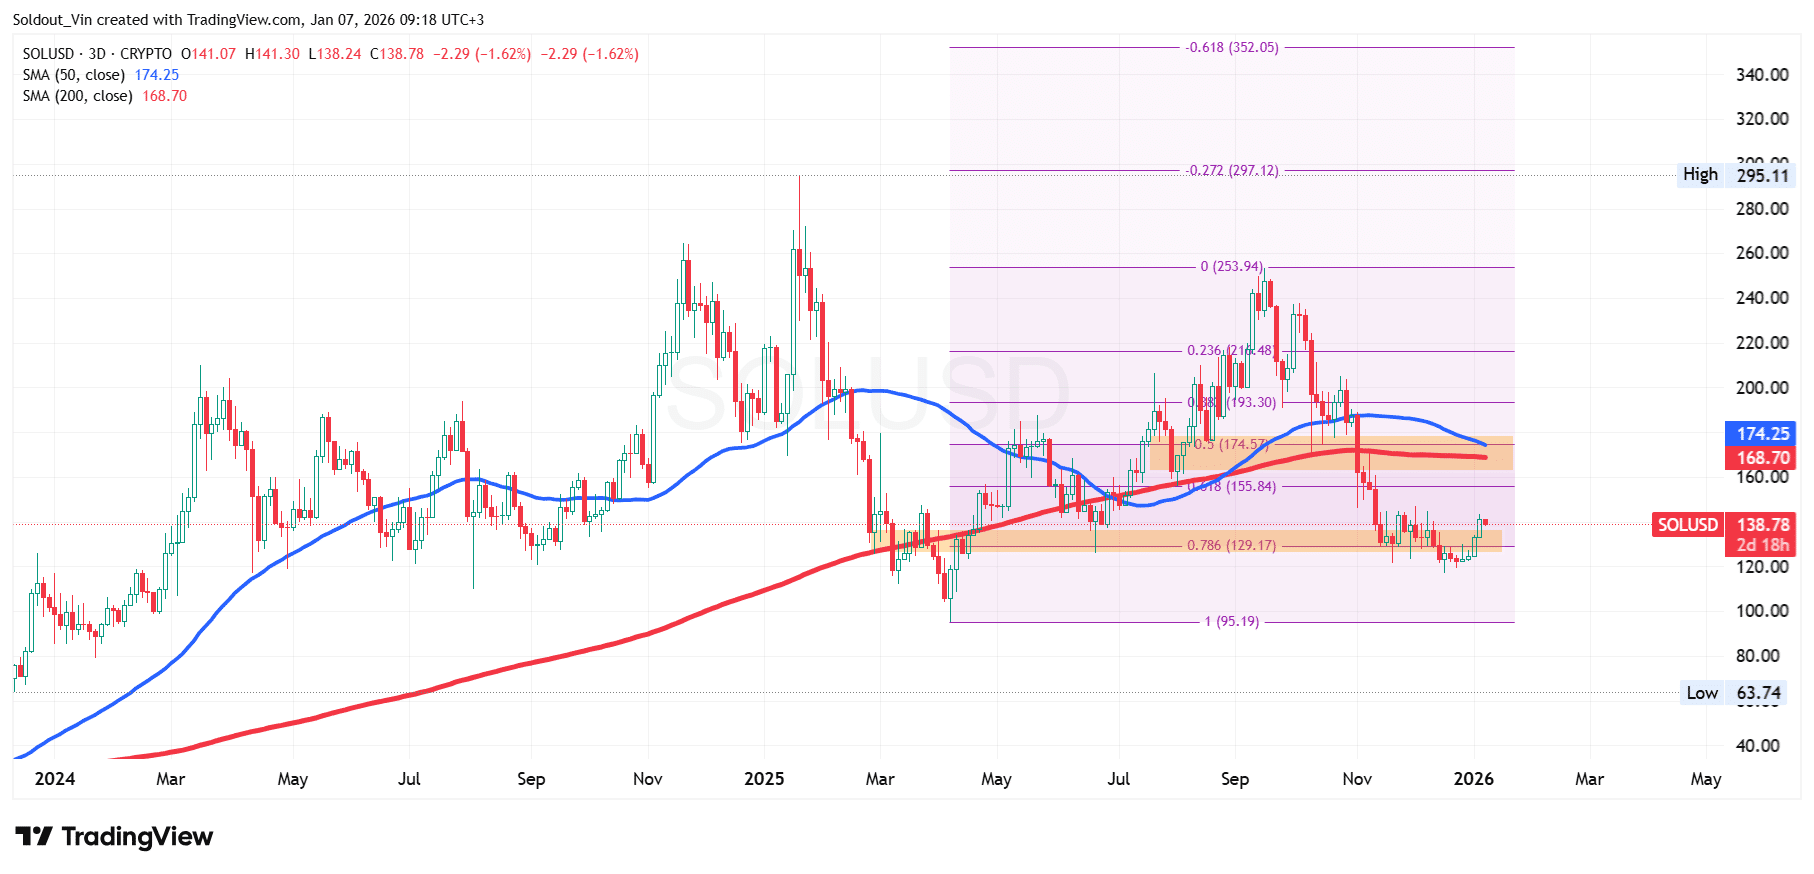
The SOL price chart analysis on the 3-day timeframe shows that Solana has broken out of the $135 support level, which coincides with a lower support area during a consolidation phase that has capped the asset below the $168 resistance.
With the attempted surge, key Fibonacci Retracement levels to watch are $155.84 (0.618 Fib level) and $174.57 (0.5 Fib level), with the 50-day and 200-day Simple Moving Averages (SMAs) at $174.25 and $168.70, respectively.
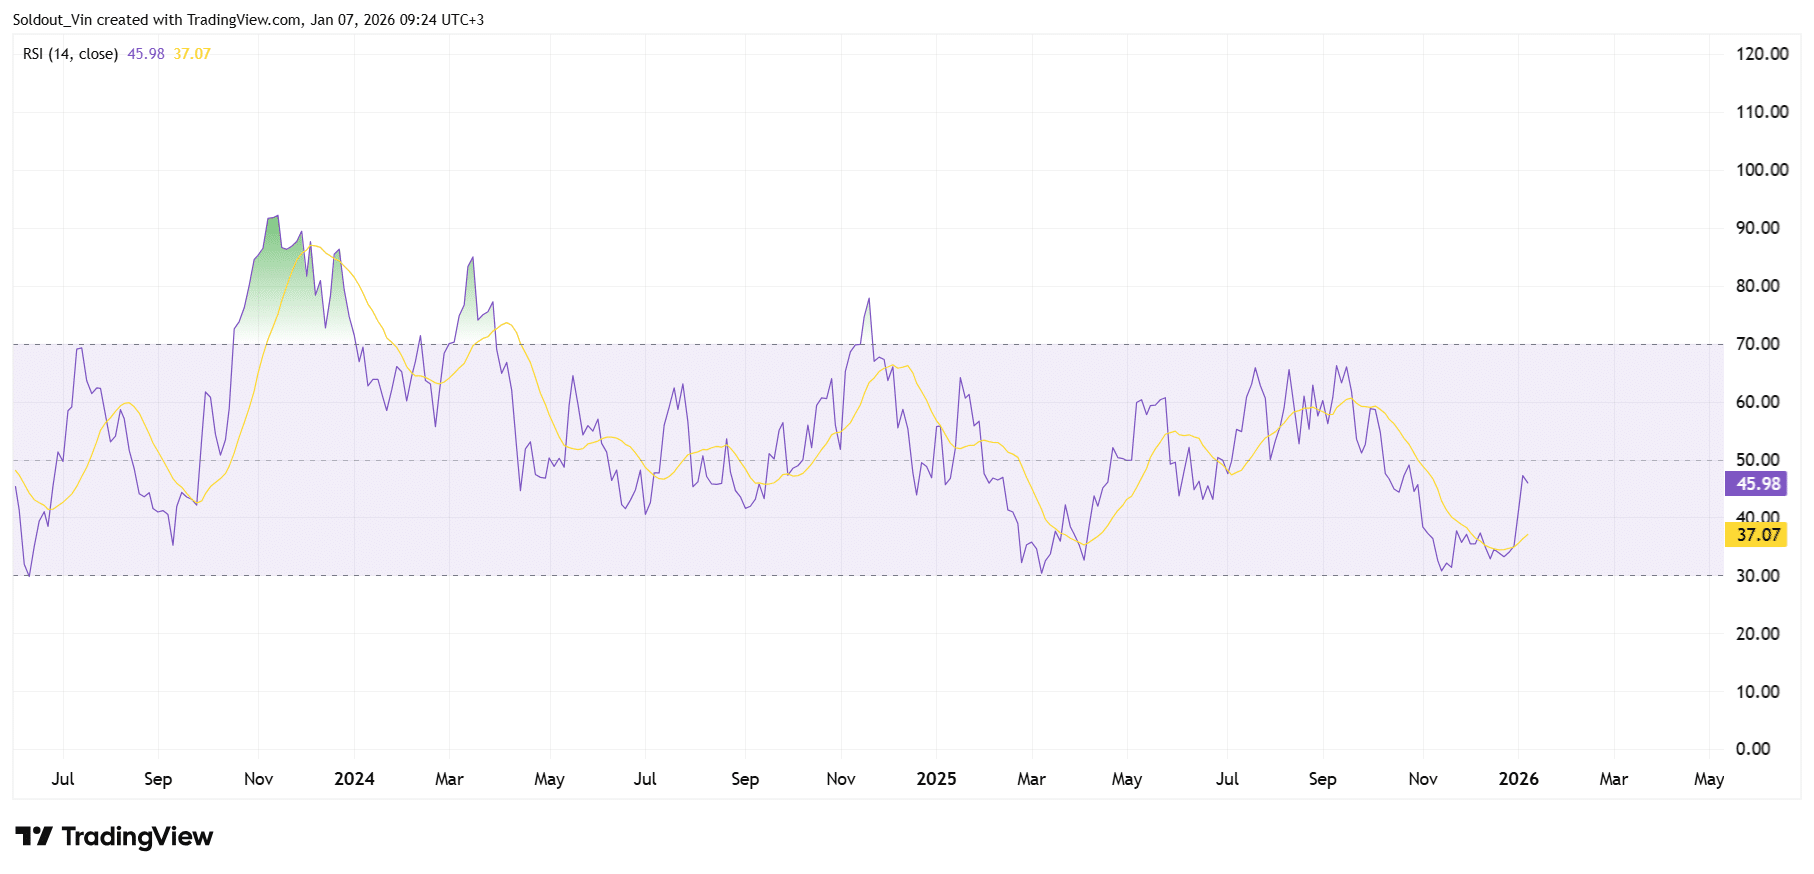
The Solana Relative Strength Index (RSI) is at 45.98 and rising, indicating that buying pressure is increasing but still within the equilibrium zone. There is some resistance on the 47.7 area, but if it rises higher than this, buyers may take full control to push Solana price past the $155.84 immediate resistance.
The trading volume surged by over 14% in the last 24 hours to $6.26 billion, indicating market activity has picked up. Despite this, Solana is down from the $143.09 level, as shown by the recent candle on the 3-day chart.
Can The SOL Price Soar To $200?
According to the SOL/USD chart analysis, the SOL price is currently poised for a bullish breakout continuation. Therefore, the $200 level is possible, as long as the Solana price continues to trade above the $129.17 area (0.786 Fib level).
This could happen, as every time the price of Solana has dropped back to the $120 zone from February 2024, it has recovered massively.
With the recent correction from the $143 level, investors are still cautious, as the asset still has the risk to drop back to the $121.41 long-term support area.
Related News:
Best Wallet – Diversify Your Crypto Portfolio

- Easy to Use, Feature-Driven Crypto Wallet
- Get Early Access to Upcoming Token ICOs
- Multi-Chain, Multi-Wallet, Non-Custodial
- Now On App Store, Google Play
- Stake To Earn Native Token $BEST
- 250,000+ Monthly Active Users
Join Our Telegram channel to stay up to date on breaking news coverage