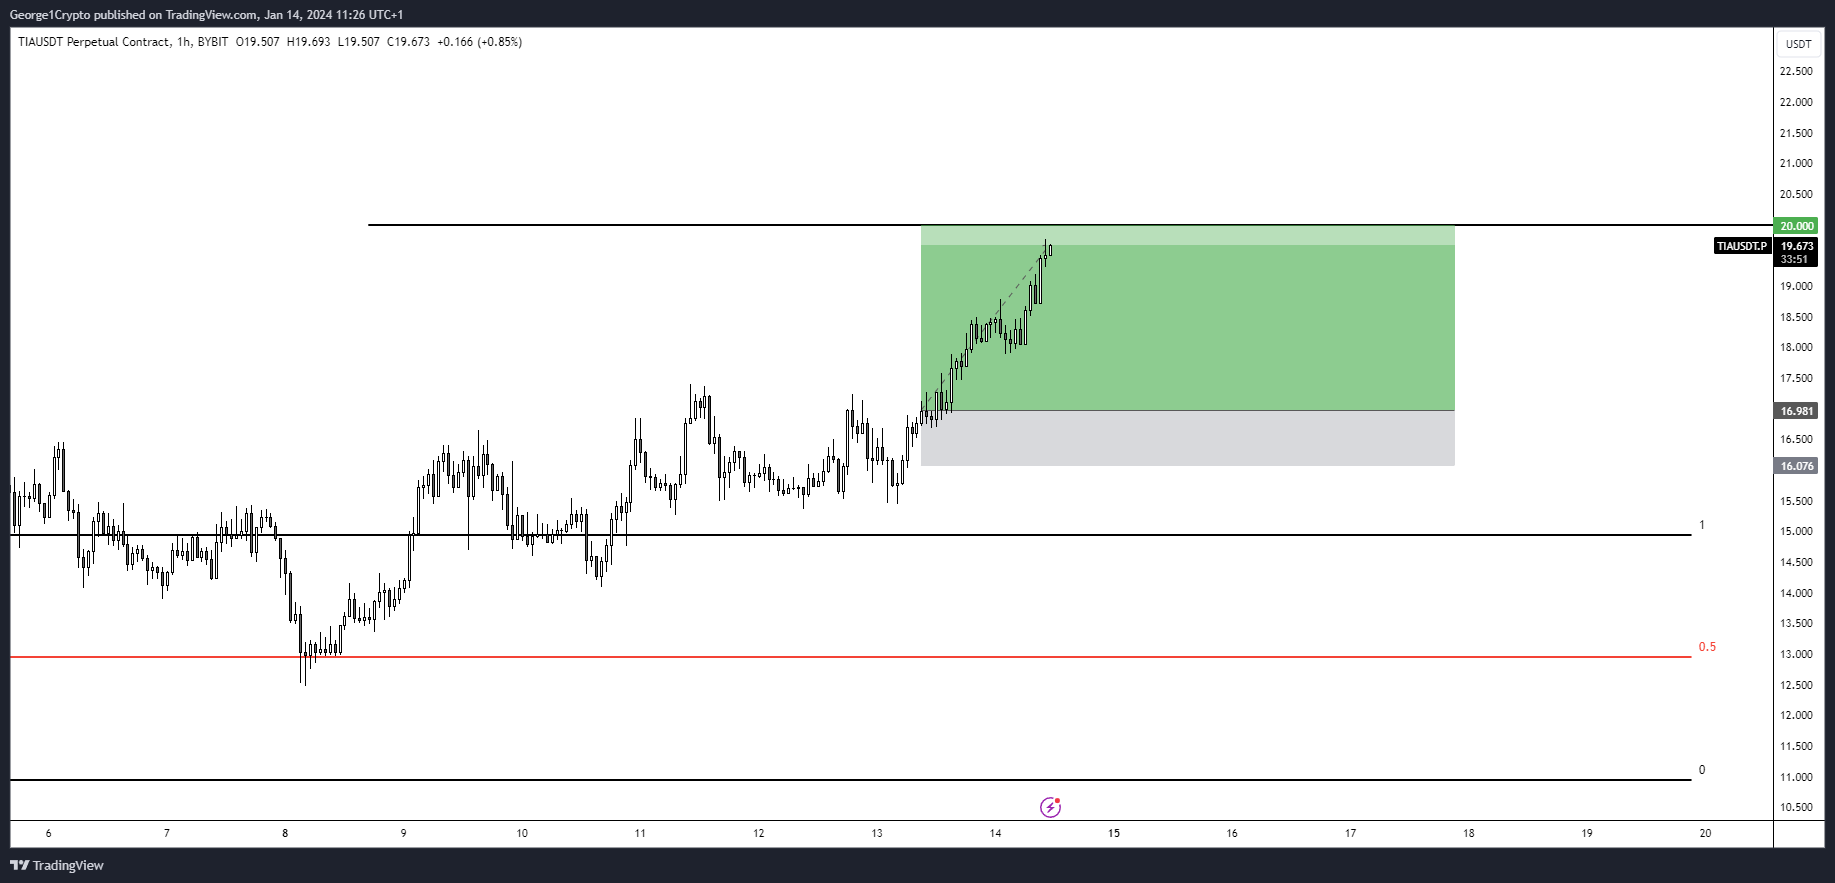
The Celestia (TIA) price has increased swiftly since January 3, reaching a new all-time high price of $20.18 today.
TIA trades at the resistance trend line of a long-term pattern. Will it break out or get rejected?
TIA Reaches Channel’s Resistance
The technical analysis of the daily time frame shows that TIA has increased alongside an ascending parallel channel since November. More recently, it bounced at the support trend line twice (green icons) on January 3 and 8, respectively.
The TIA price has accelerated since, reaching a new all-time high of $2.18 today. The high was made at the channel’s resistance trend line. However, TIA fell slightly after reaching the high.
The RSI is a momentum indicator traders use to evaluate whether a market is overbought or oversold and whether to accumulate or sell an asset.
Readings above 50 and an upward trend suggest that bulls still have an advantage, while readings below 50 indicate the opposite. The weekly RSI is bullish since it is increasing and has moved above 70 (green icon).
Read More: Top 9 Telegram Channels for Crypto Signals
What do Analysts Say?
Several cryptocurrency traders and analysts have a positive view on the future TIA price trend.
George1Trader noted the TIA price has reached his target of $20.

ColdBloodShill believes the price will continue to increase, tweeting:
Looks as though the new trend is starting to spread it’s wings.
Hokage urged his followers to stake at least $50 of TIA to farm airdrops, while Jay is impressed by the rally.
Read More: Best Upcoming Airdrops
TIA Price Prediction: How Long Will Increase Continue?
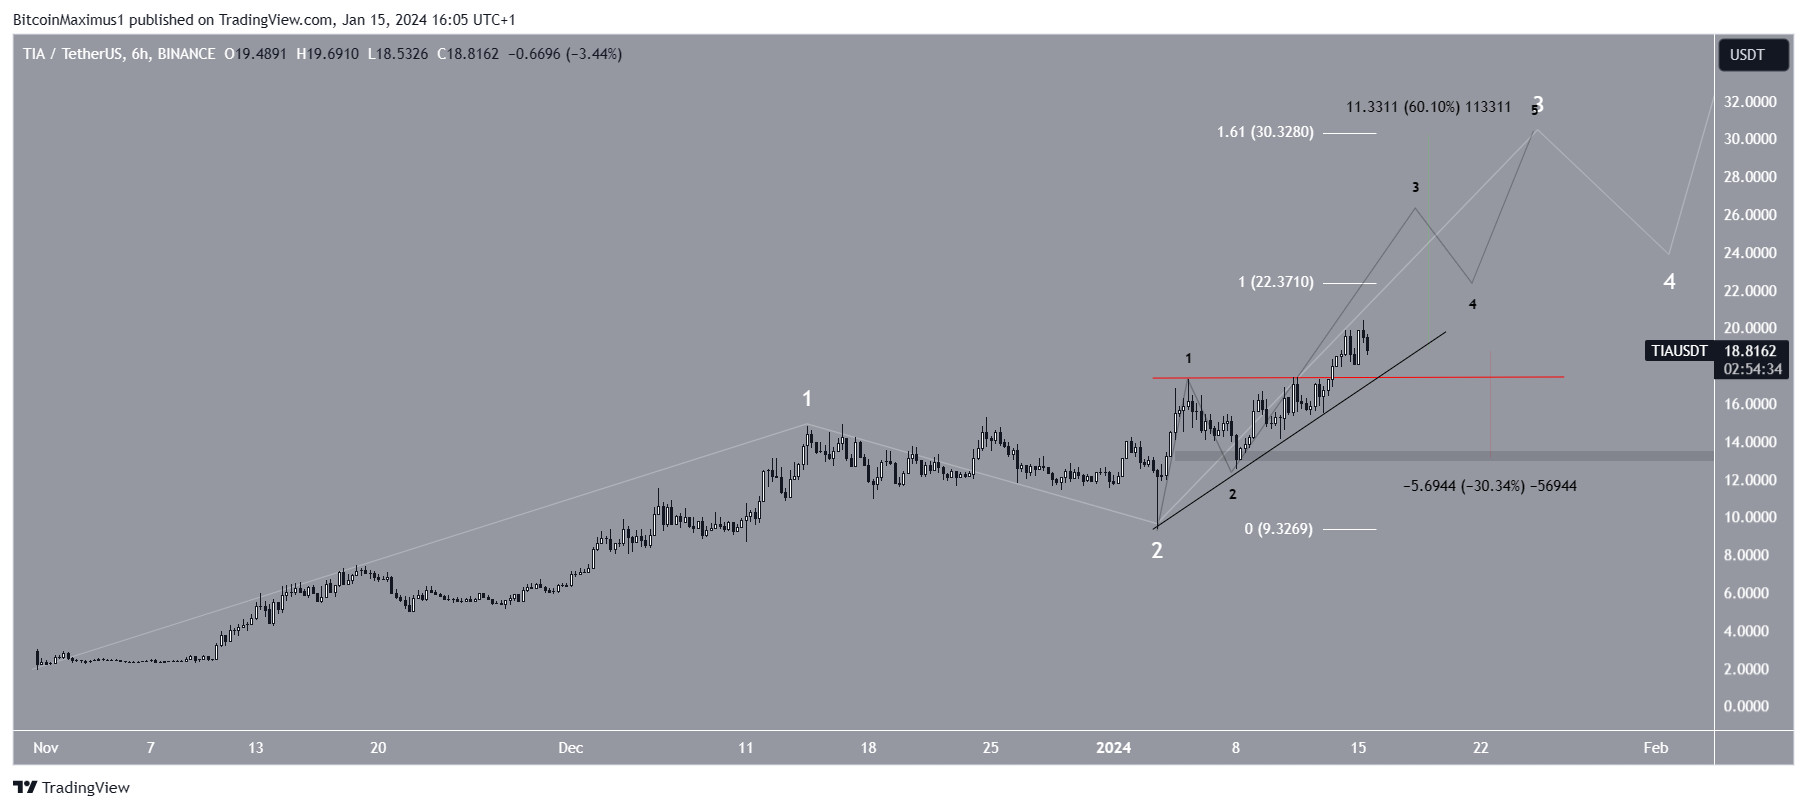
The six-hour time frame suggests the TIA increase will continue because of its bullish wave count.
Technical analysts utilize the Elliott Wave theory to ascertain the trend’s direction by studying recurring long-term price patterns and investor psychology.
The most likely count suggests that TIA is in wave three of a five-wave upward movement (white). The sub-wave count is in black, showing that wave three has extended.
If the count is correct, TIA can increase by 60% to the next resistance at $30, giving waves one and three a 1:1.61 ratio.

Despite this bullish TIA price prediction, falling below the wave one high at $17.50 (red) will invalidate the count. This can cause a 30% fall to the closest support at $13.30.
For BeInCrypto’s latest crypto market analysis, click here.
Read More: 9 Best Crypto Demo Accounts For Trading
![]()
Coinbase
Coinbase” target=”_blank”>Explore →
![]()
iTrustCapital
iTrustCapital” target=”_blank”>Explore →
![]()
Metamask Portfolio
Metamask Portfolio” target=”_blank”> Explore →
![]()
UpHold
UpHold” target=”_blank”>Explore →
![]()
eToro
eToro” target=”_blank”>Explore →
![]()
BYDFi
BYDFi” target=”_blank”>Explore →
Explore more
The post Celestia (TIA) Hits $20 and Retreats – Analyzing Its Market Movement appeared first on BeInCrypto.
