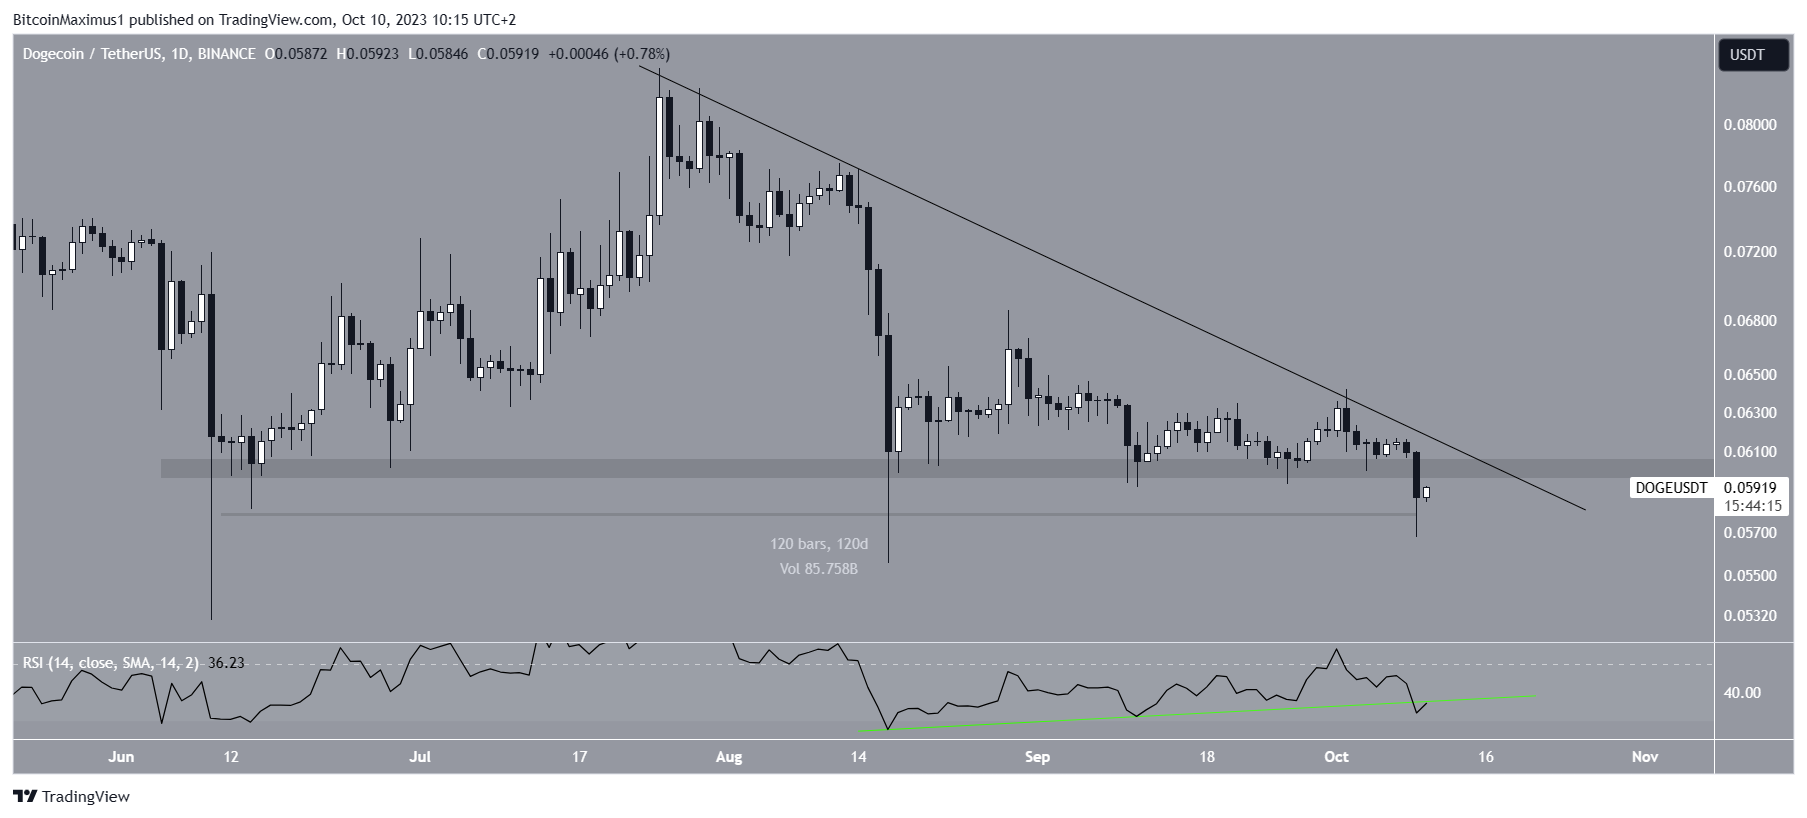
The Dogecoin (DOGE) price broke down from a 120-day horizontal support area on October 9.
Despite the DOGE price breakdown, the cryptocurrency still trades inside a longer-term horizontal support level.
Dogecoin Falls Below 120-Day Support Area
The daily timeframe technical analysis shows that the DOGE price has traded above the $0.060 horizontal support area since June 10.
Moreover, it shows that DOGE has fallen under a descending resistance trendline since July 25. Together, they create a descending triangle, considered a bearish pattern.
Invest smarter with our DOGE price predictors.
Dogecoin’s volatility returned on October 9, causing a breakdown from the support area. This led to a low of $0.057, the lowest price since August 17, when the altcoin had fallen to a low of $0.055.
The DOGE price bounced slightly yesterday, creating a long lower wick, but has not reached the $0.060 area yet.
The daily Relative Strength Index (RSI) is bearish. The RSI is a momentum indicator that assists traders in determining if the market is overbought or oversold. This offers an indication to either accumulate or sell an asset.
If the RSI reading is above 50 and the trend is upward, bulls have an advantage, but if the reading is below 50, the opposite is true.
The indicator is below 50 and falling, both considered signs of a bearish trend. Additionally, the indicator broke down from its bullish divergence trendline (green line).
DOGE Price Prediction: Where to Next After Breakdown?
The weekly timeframe also offers a bearish outlook. There are two main reasons for this.
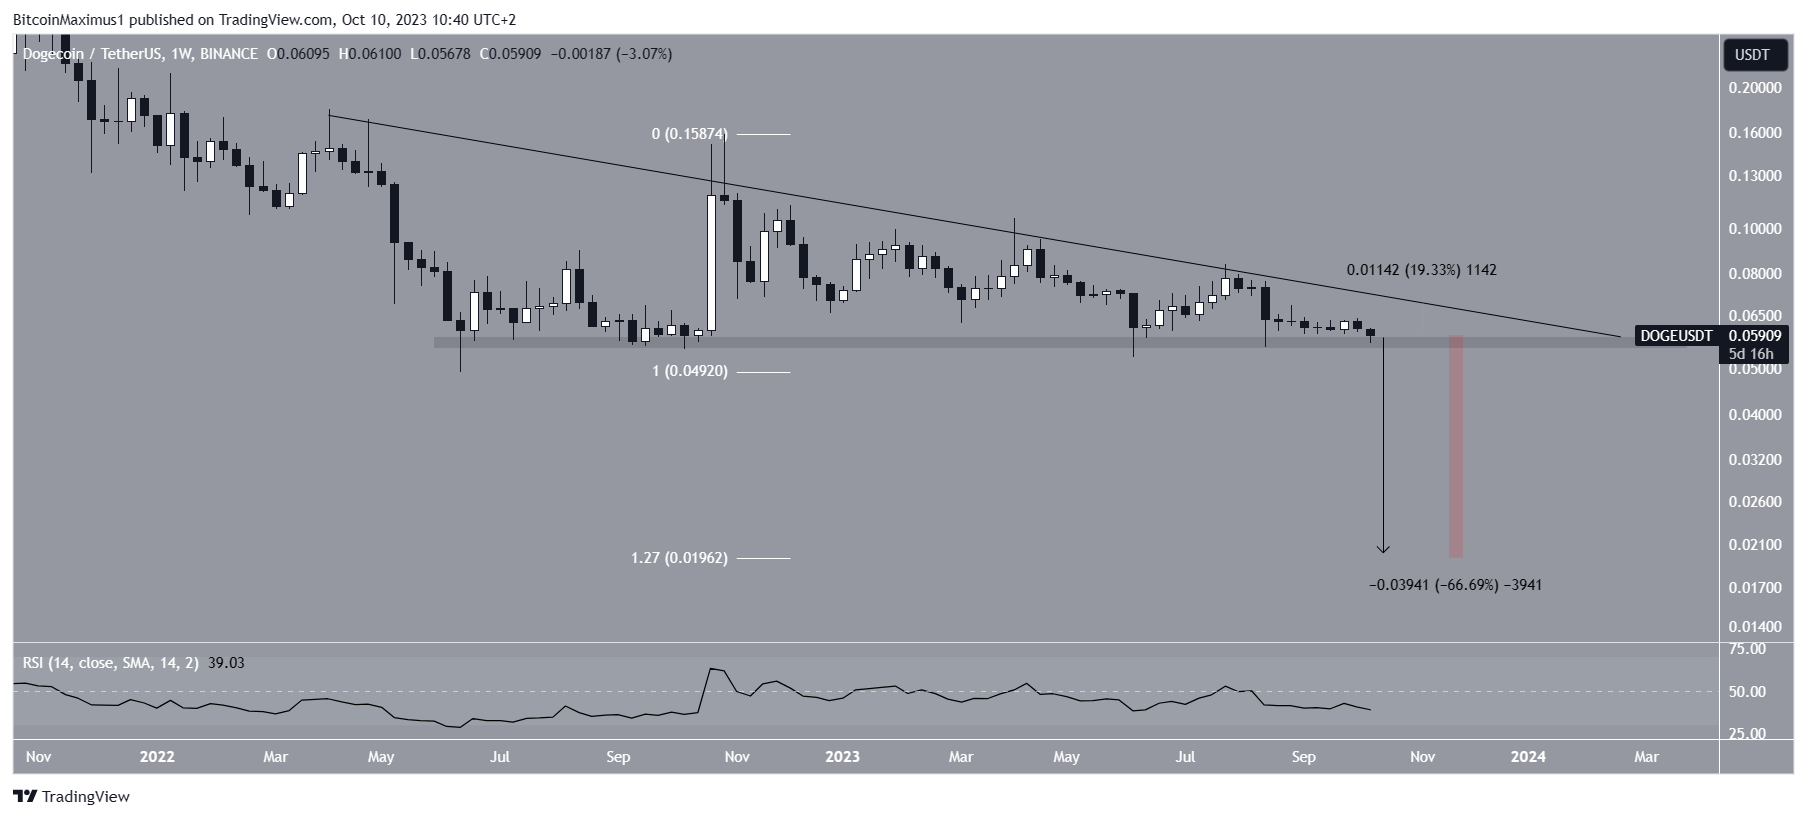
Firstly, the DOGE price trades inside a larger descending triangle pattern, with a base at $0.057. As outlined before, this is considered a bearish pattern.
A breakdown that travels the entire triangle’s height (black line) will take DOGE to $0.020. This is a decrease of 67%, measuring from the current price.
Check Out the Best Upcoming Airdrops in 2023
The 1.27 Fib extension (white) also supports this area as a local bottom since it falls at $0.020.
According to the Fibonacci retracement levels theory, following a significant price change in one direction, the price is expected to partially return to a previous price level before continuing in the same direction.
This theory can also be used to identify the bottom of future downward movements.
Similarly to the daily timeframe, the weekly RSI is bearish since it is below 50 and falling.

Despite this bearish DOGE price prediction, a strong bounce at the long-term horizontal support area of $0.057 can lead to a 20% increase to the long-term descending resistance trendline, currently at $0.070.
Read More: Crypto Signals: What Are They and How to Use Them
For BeInCrypto’s latest crypto market analysis, click here.
The post Dogecoin (DOGE) Price Falls to 52-Day Low – Is the Worst Over? appeared first on BeInCrypto.
