- Dogecoin saw low spot demand and the Open Interest lacked a trend, like the price.
- The consolidation pattern formed over the past ten days was more likely to see a southward breakout.
A recent Dogecoin [DOGE] report noted that the whales were accumulating.
However, the price action and technical indicators were muted and showed that the bearish scenario was more likely than a bullish move over the next week or two.
Dogecoin price prediction — Bulls defend key Fibonacci support

Source: DOGE/USDT on TradingView
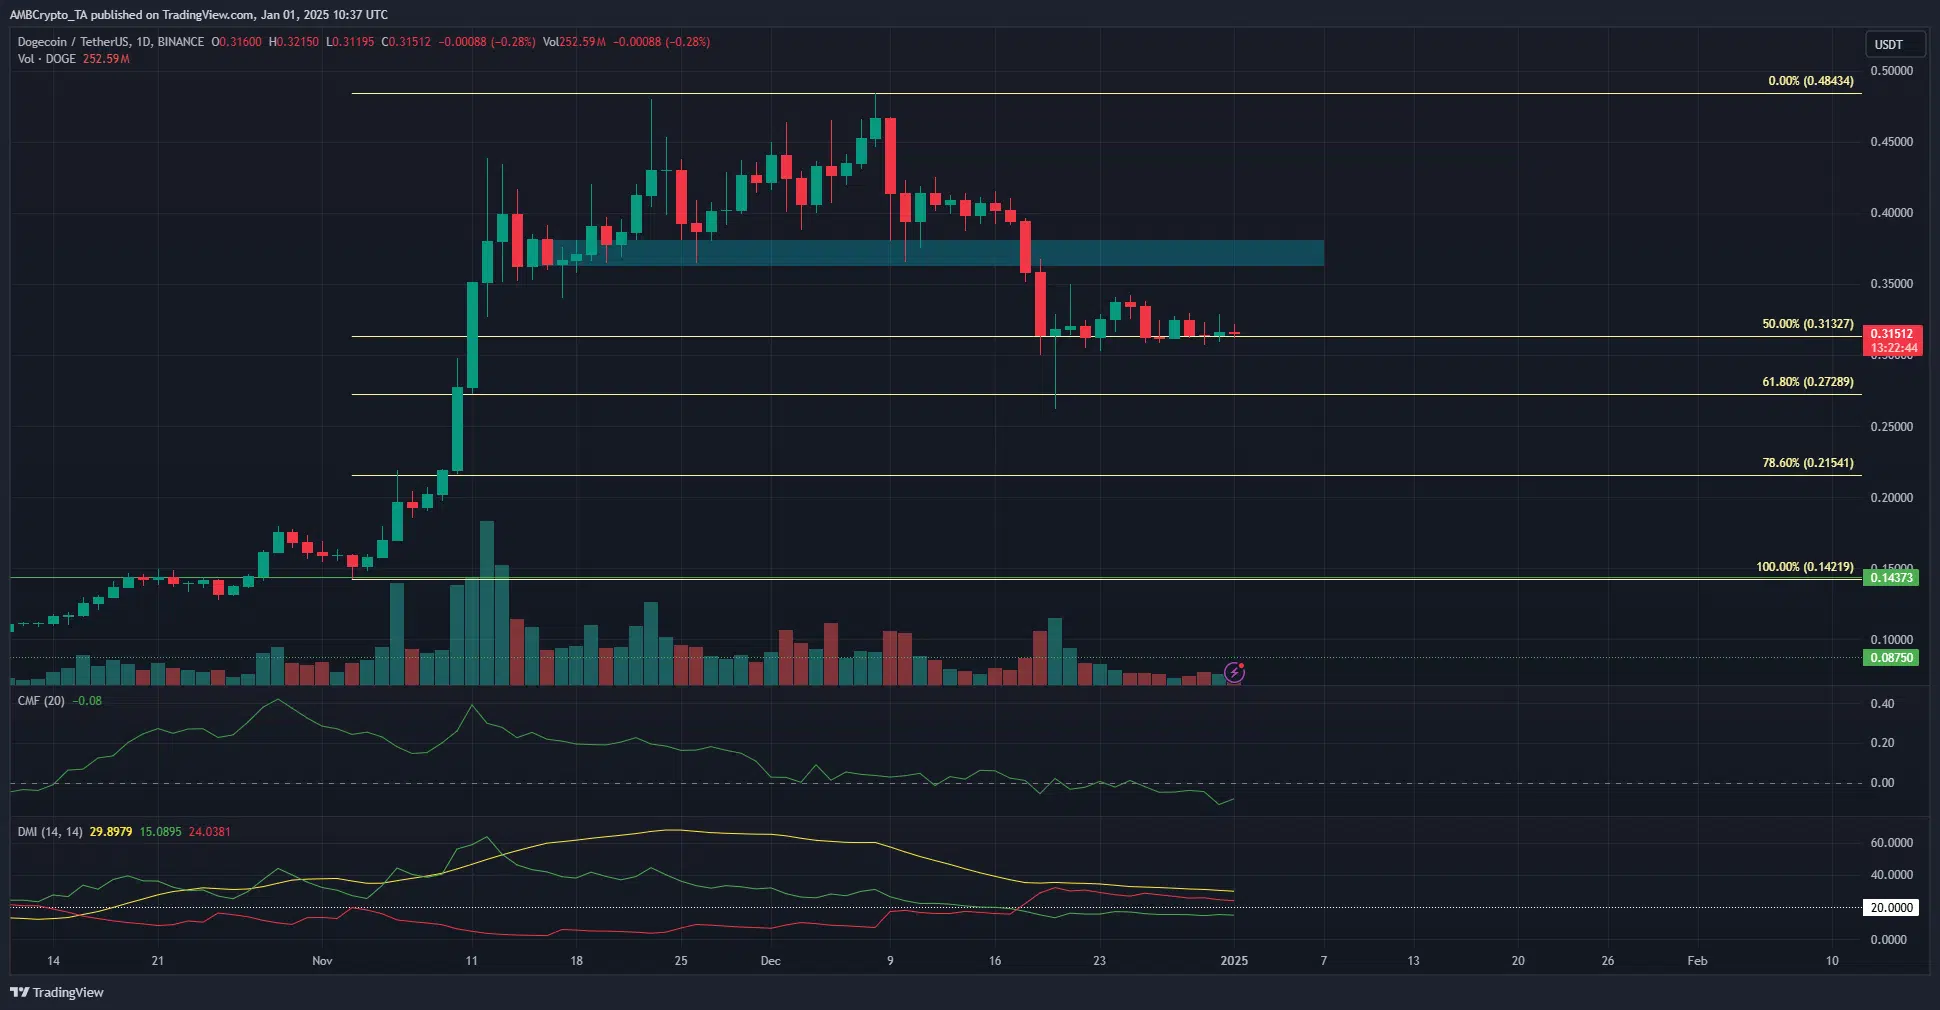
The 1-day timeframe showed that Dogecoin has a bearish bias. It was unable to defend the bullish order block at $0.38 during the price retracement two weeks ago.
Since then, it has fallen to settle at the $0.313 support level.
This level was the 50% retracement from the rally that began in the first week of December. The DOGE bulls’ defense of this level over the past two weeks was remarkable, but it might not last.
The CMF was at -0.08 to show significant capital outflows.
The Directional Movement Index signaled a strong bearish trend on the daily, with both the ADX (yellow) and the -DI (red) both above 20.
Taken together, the trend and selling pressure combined meant the Dogecoin price prediction was bearish. Another retest of the $0.272 support was likely.
Consolidation and neutral sentiment on the lower timeframe


Source: DOGE/USDT on TradingView
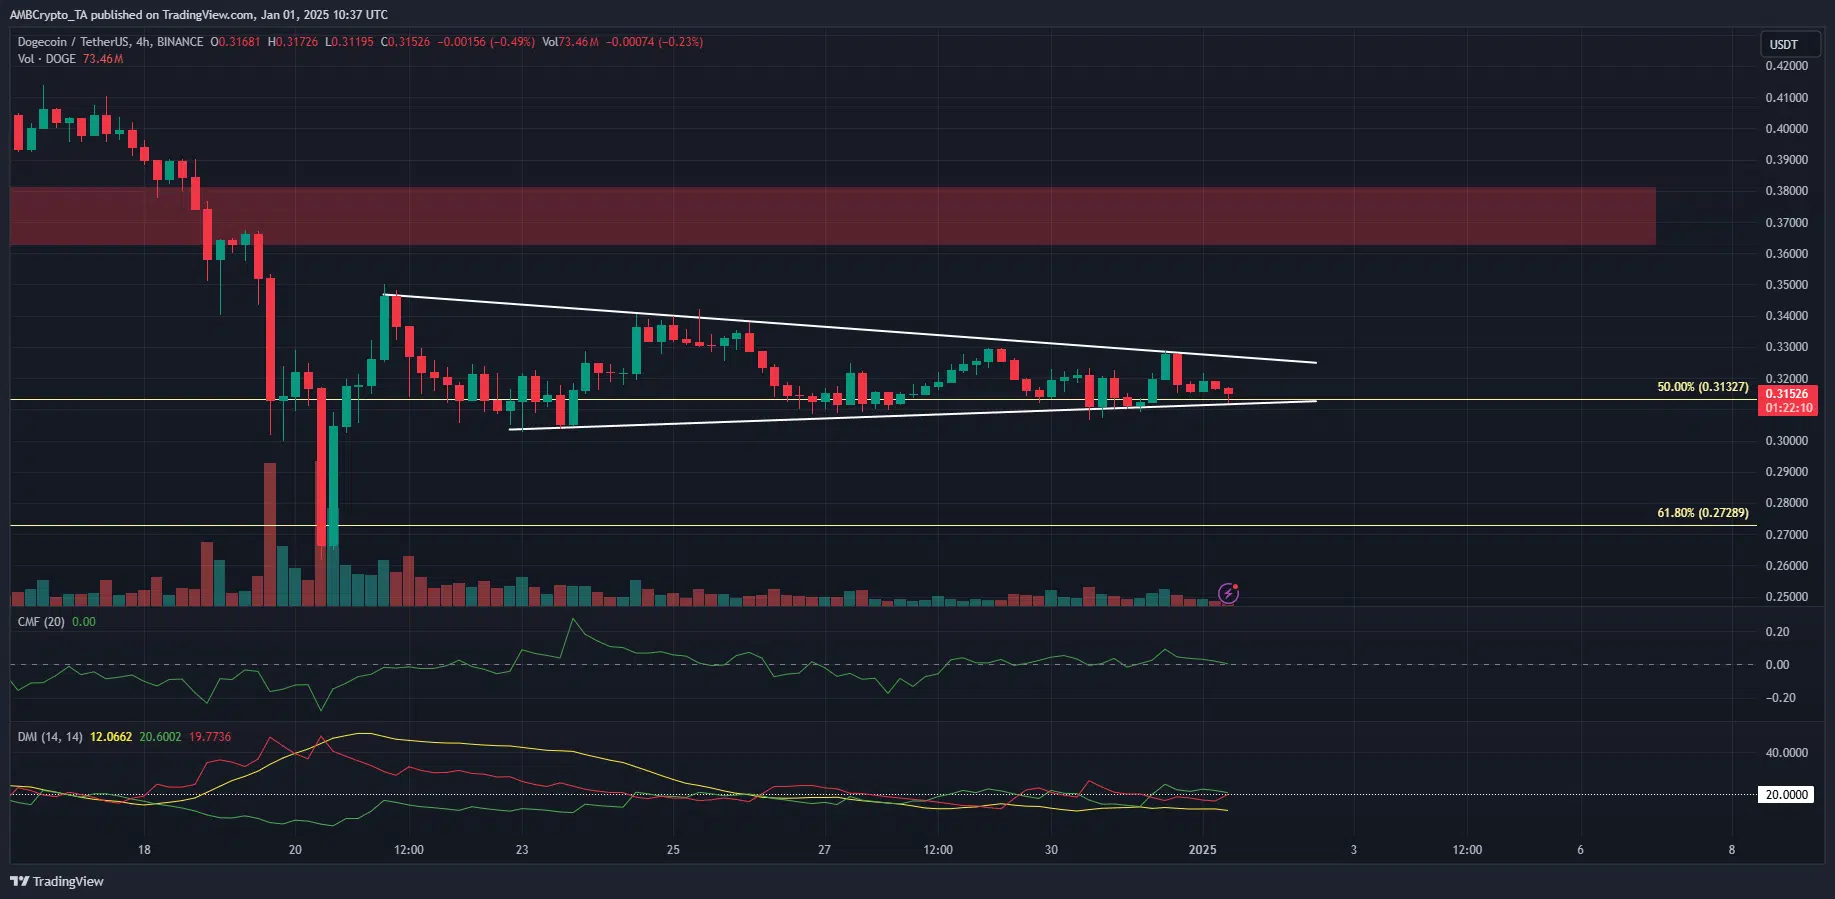
The 4-hour chart gave more clues. AMBCrypto found that the meme coin was trading within a symmetrical triangle pattern. By itself, it was neither bullish nor bearish.
This consolidation pattern was a warning that a breakout in either direction was possible.
Extra volatility due to a liquidity hunt in one direction followed by a trend reversal and an impulse move can not be ruled out either.
In other words, beware of a breakout since it could be a fake move before the higher timeframe trend continuation.
Since the daily chart was bearish, a move toward $0.33-$0.35 could be the fake-out before further losses materialize.
A move beyond $0.346 and $0.38 is needed to flip the daily bias bullishly.


Source: Coinalyze
Realistic or not, here’s DOGE’s market cap in BTC’s terms
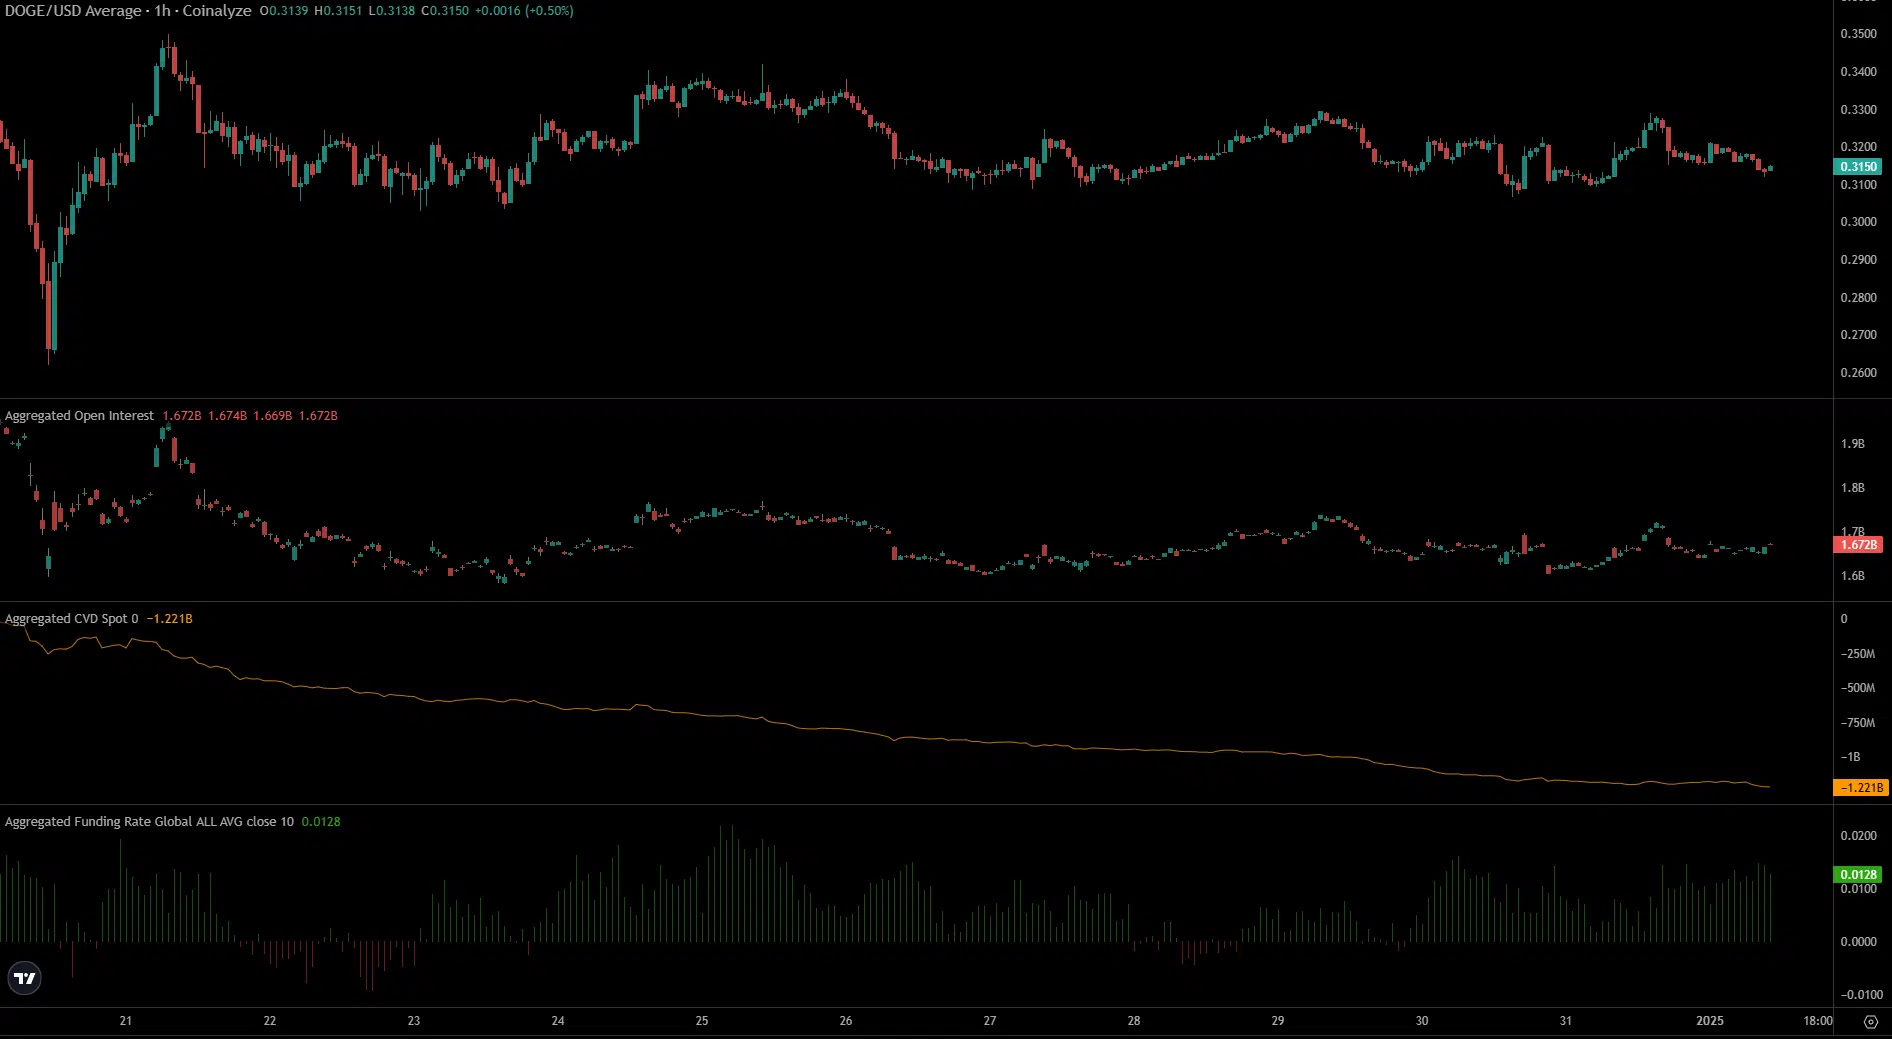
Data from Coinalyze reflected the lack of spot buying pressure. Speculators were content to remain sidelined, based on the lack of movement from the Open Interest over the past week.
Overall, though the funding rate was rising, the bullish sentiment was found lacking in the hourly timeframe as well.
Disclaimer: The information presented does not constitute financial, investment, trading, or other types of advice and is solely the writer’s opinion
