
Ethereum finally broke above $3,000 today, a psychological level it’s struggled with for months. But what’s notable is what drove the move; a spike in short-term wallet activity that suggests retail demand is waking up.
Combined with consistent ETF inflows and structural resistance levels now being tested, ETH appears poised for its next major move. The real question: can this momentum hold?
Retail Demand is Waking Up, and It’s Visible On-Chain
ETH price break above $3,000 isn’t just technical; it’s behavioral. According to Glassnode’s HODL Waves, which measure the percentage of ETH held across different age bands, short-term holders (especially 1w–1m, 1m–3m, and even 10Y bands) have grown steadily over the past few days.
This spike shows increased participation from newer wallets, a proxy for retail demand.
Compared to the all-time HODL wave chart, where long-term holding bands usually remain dominant, this sudden bump in short-term cohorts stands out. It signals a rotation into active trading behavior.

HODL Waves represent how long coins sit in wallets. Growth in short-term bands signals renewed retail activity (new ETH acquires), while long-term bands represent cold storage and conviction. In ETH’s case, it’s both.
Wallet Clusters Could Dictate Momentum’s Next Move
As Ethereum tests the $3,000 zone, the In and Out of the Money data adds critical context to how much leg room this rally actually has.
Currently, the largest on-chain wallet cluster sits between $2,237 and $2,523, where millions of addresses are currently in profit. This range serves as the base of the current move, indicating where conviction likely originated. If momentum weakens, this level is most likely to act as strong support, as holders in profit tend to double down rather than sell.

Above current levels, however, Ethereum is entering a breakeven-heavy band between $2,968 and $3,230. Past this, the next red zone of out-of-the-money holders sits above $3,230, where profit-taking risk increases.
The In/Out of the Money metric shows where current ETH holders bought their coins. Clusters represent zones of buyer density, often acting as soft support or resistance depending on sentiment.
The breakeven band Ethereum is navigating right now is where momentum gets tested (strongest resistance to be precise). Break it cleanly, and the path to $3,500 opens up. Lose it, and the rally risks slipping back to stronger conviction zones around $2,523.
Price Levels and Momentum Hinge on Fibonacci and OBV Divergence
Ethereum’s recent push above $3,000 brings it to a key resistance zone; the 0.618 Fibonacci extension, drawn using trend-based levels from the $1,388 swing low, $2,869 peak, and the retracement low of $2,123. This puts $3,045 as the immediate resistance, and $3,295 (0.786 Fib level) as the next ceiling if the rally holds.
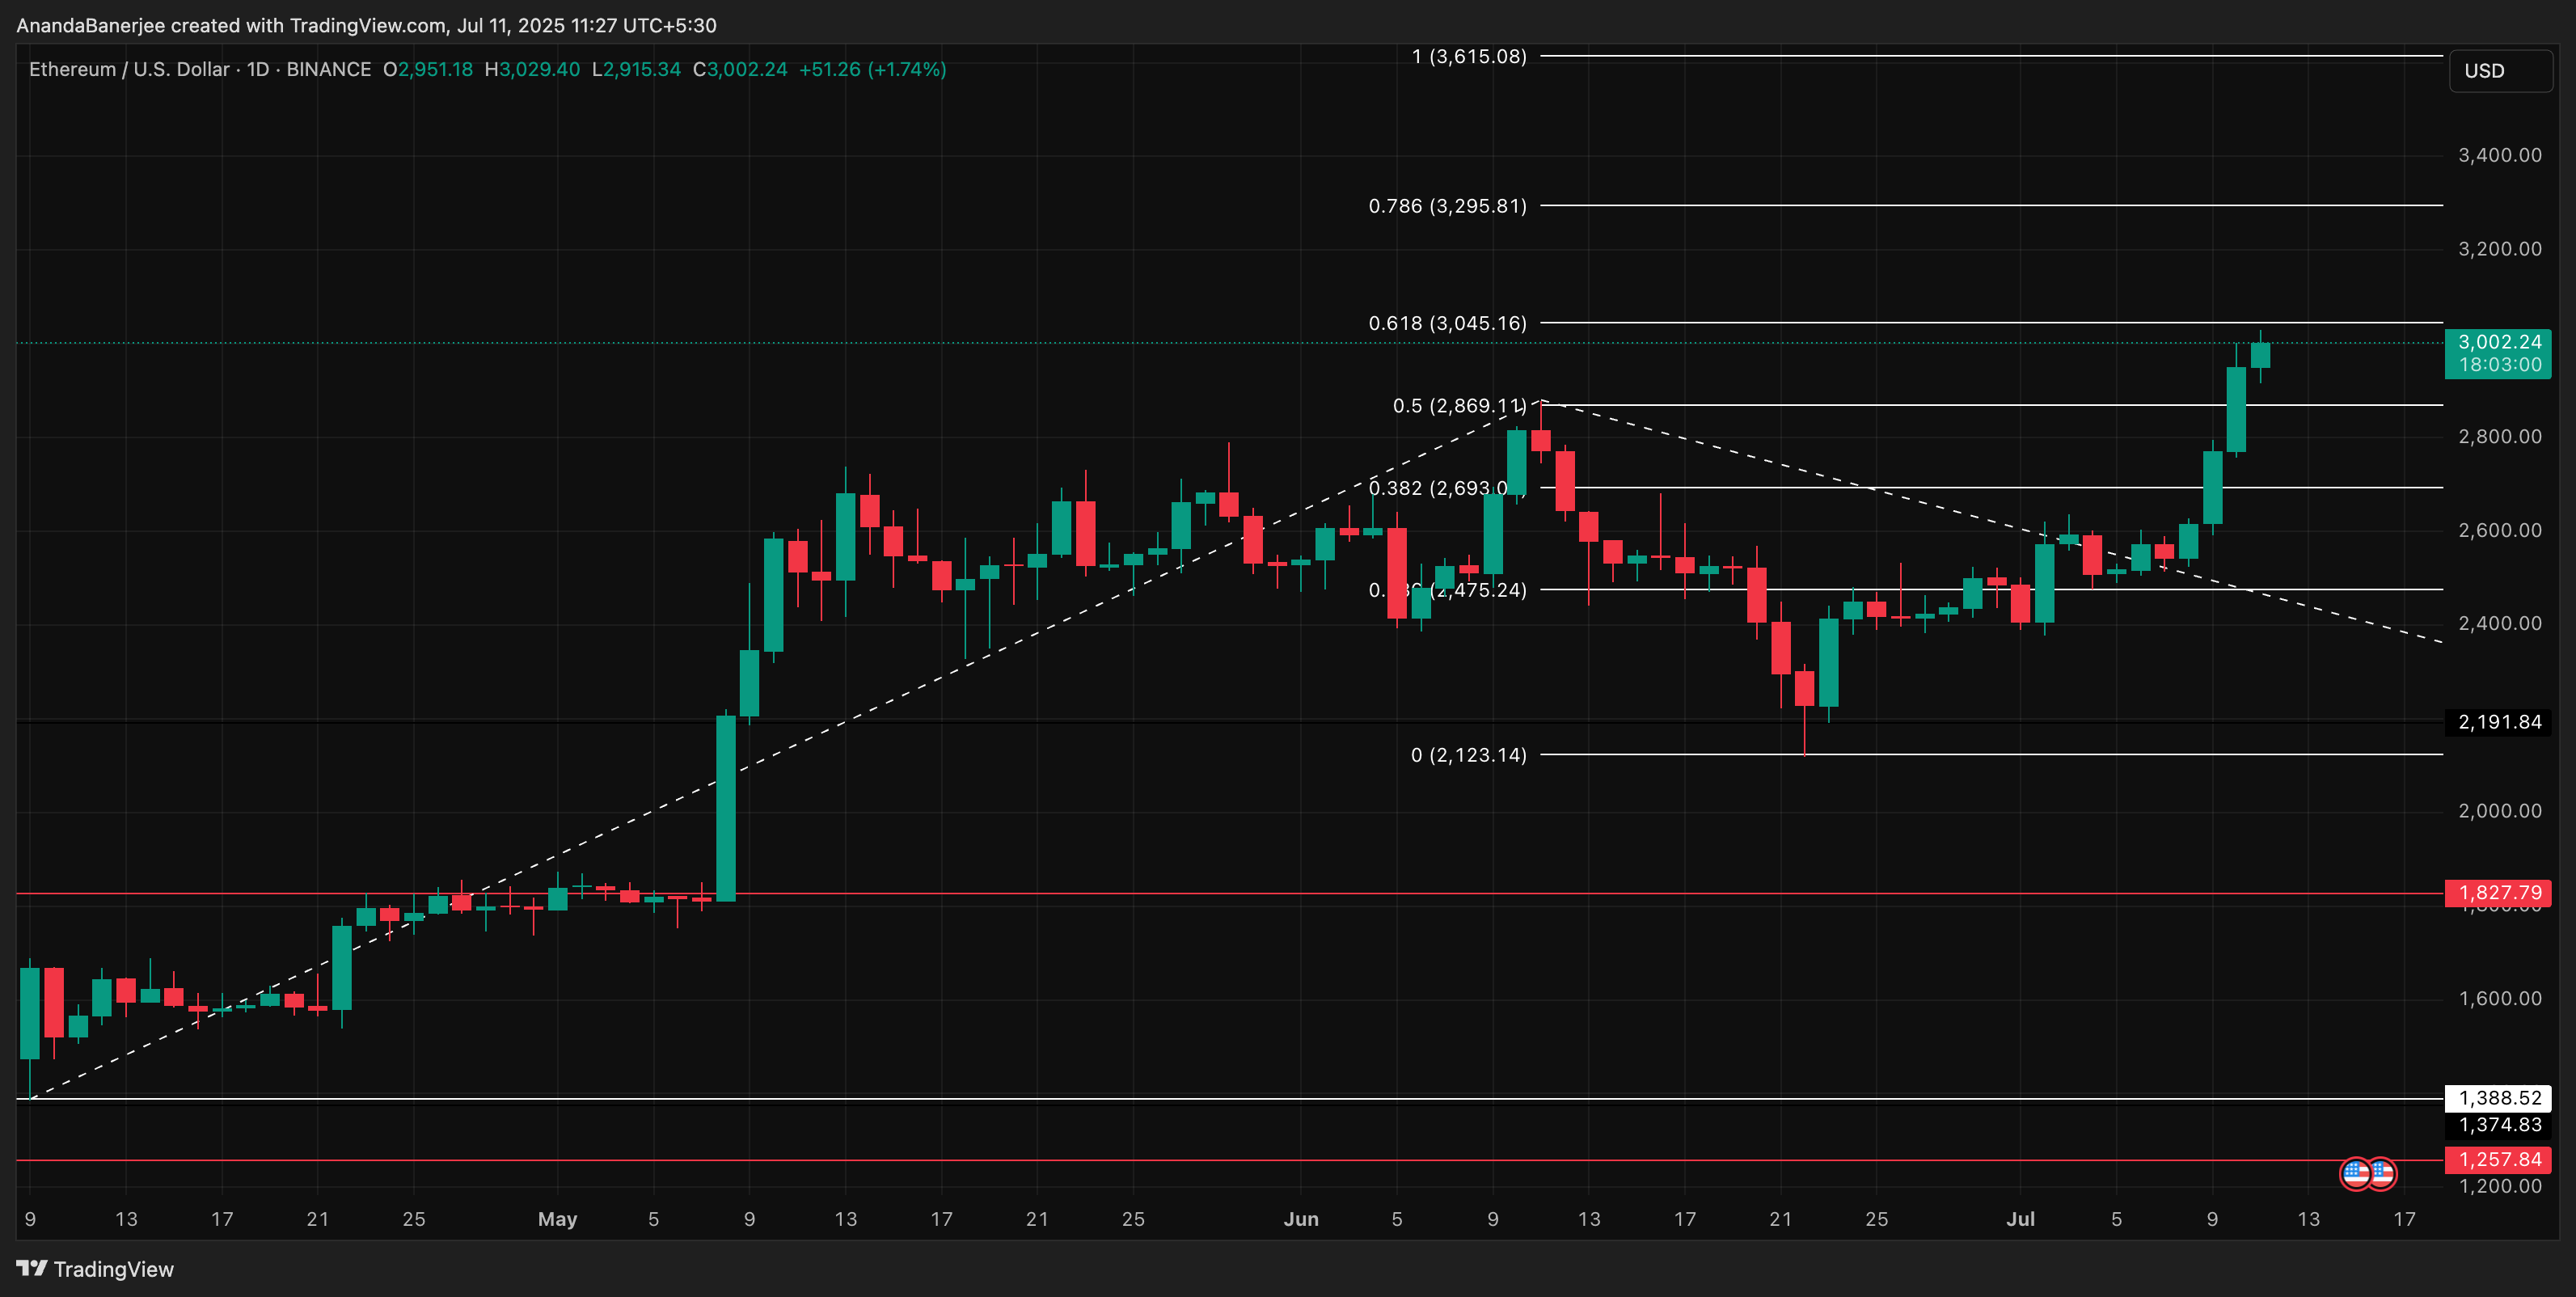
These Fib levels don’t just stand alone. They closely align with the In and Out of the Money resistance clusters between $2,968 and $3,230, where a large group of ETH holders is sitting at breakeven. This confluence reinforces the idea that momentum is being tested here, both by technicals and wallet behavior.
Above this range, the next target becomes $3,615; the 1 Fibonacci level, but only if momentum sustains.
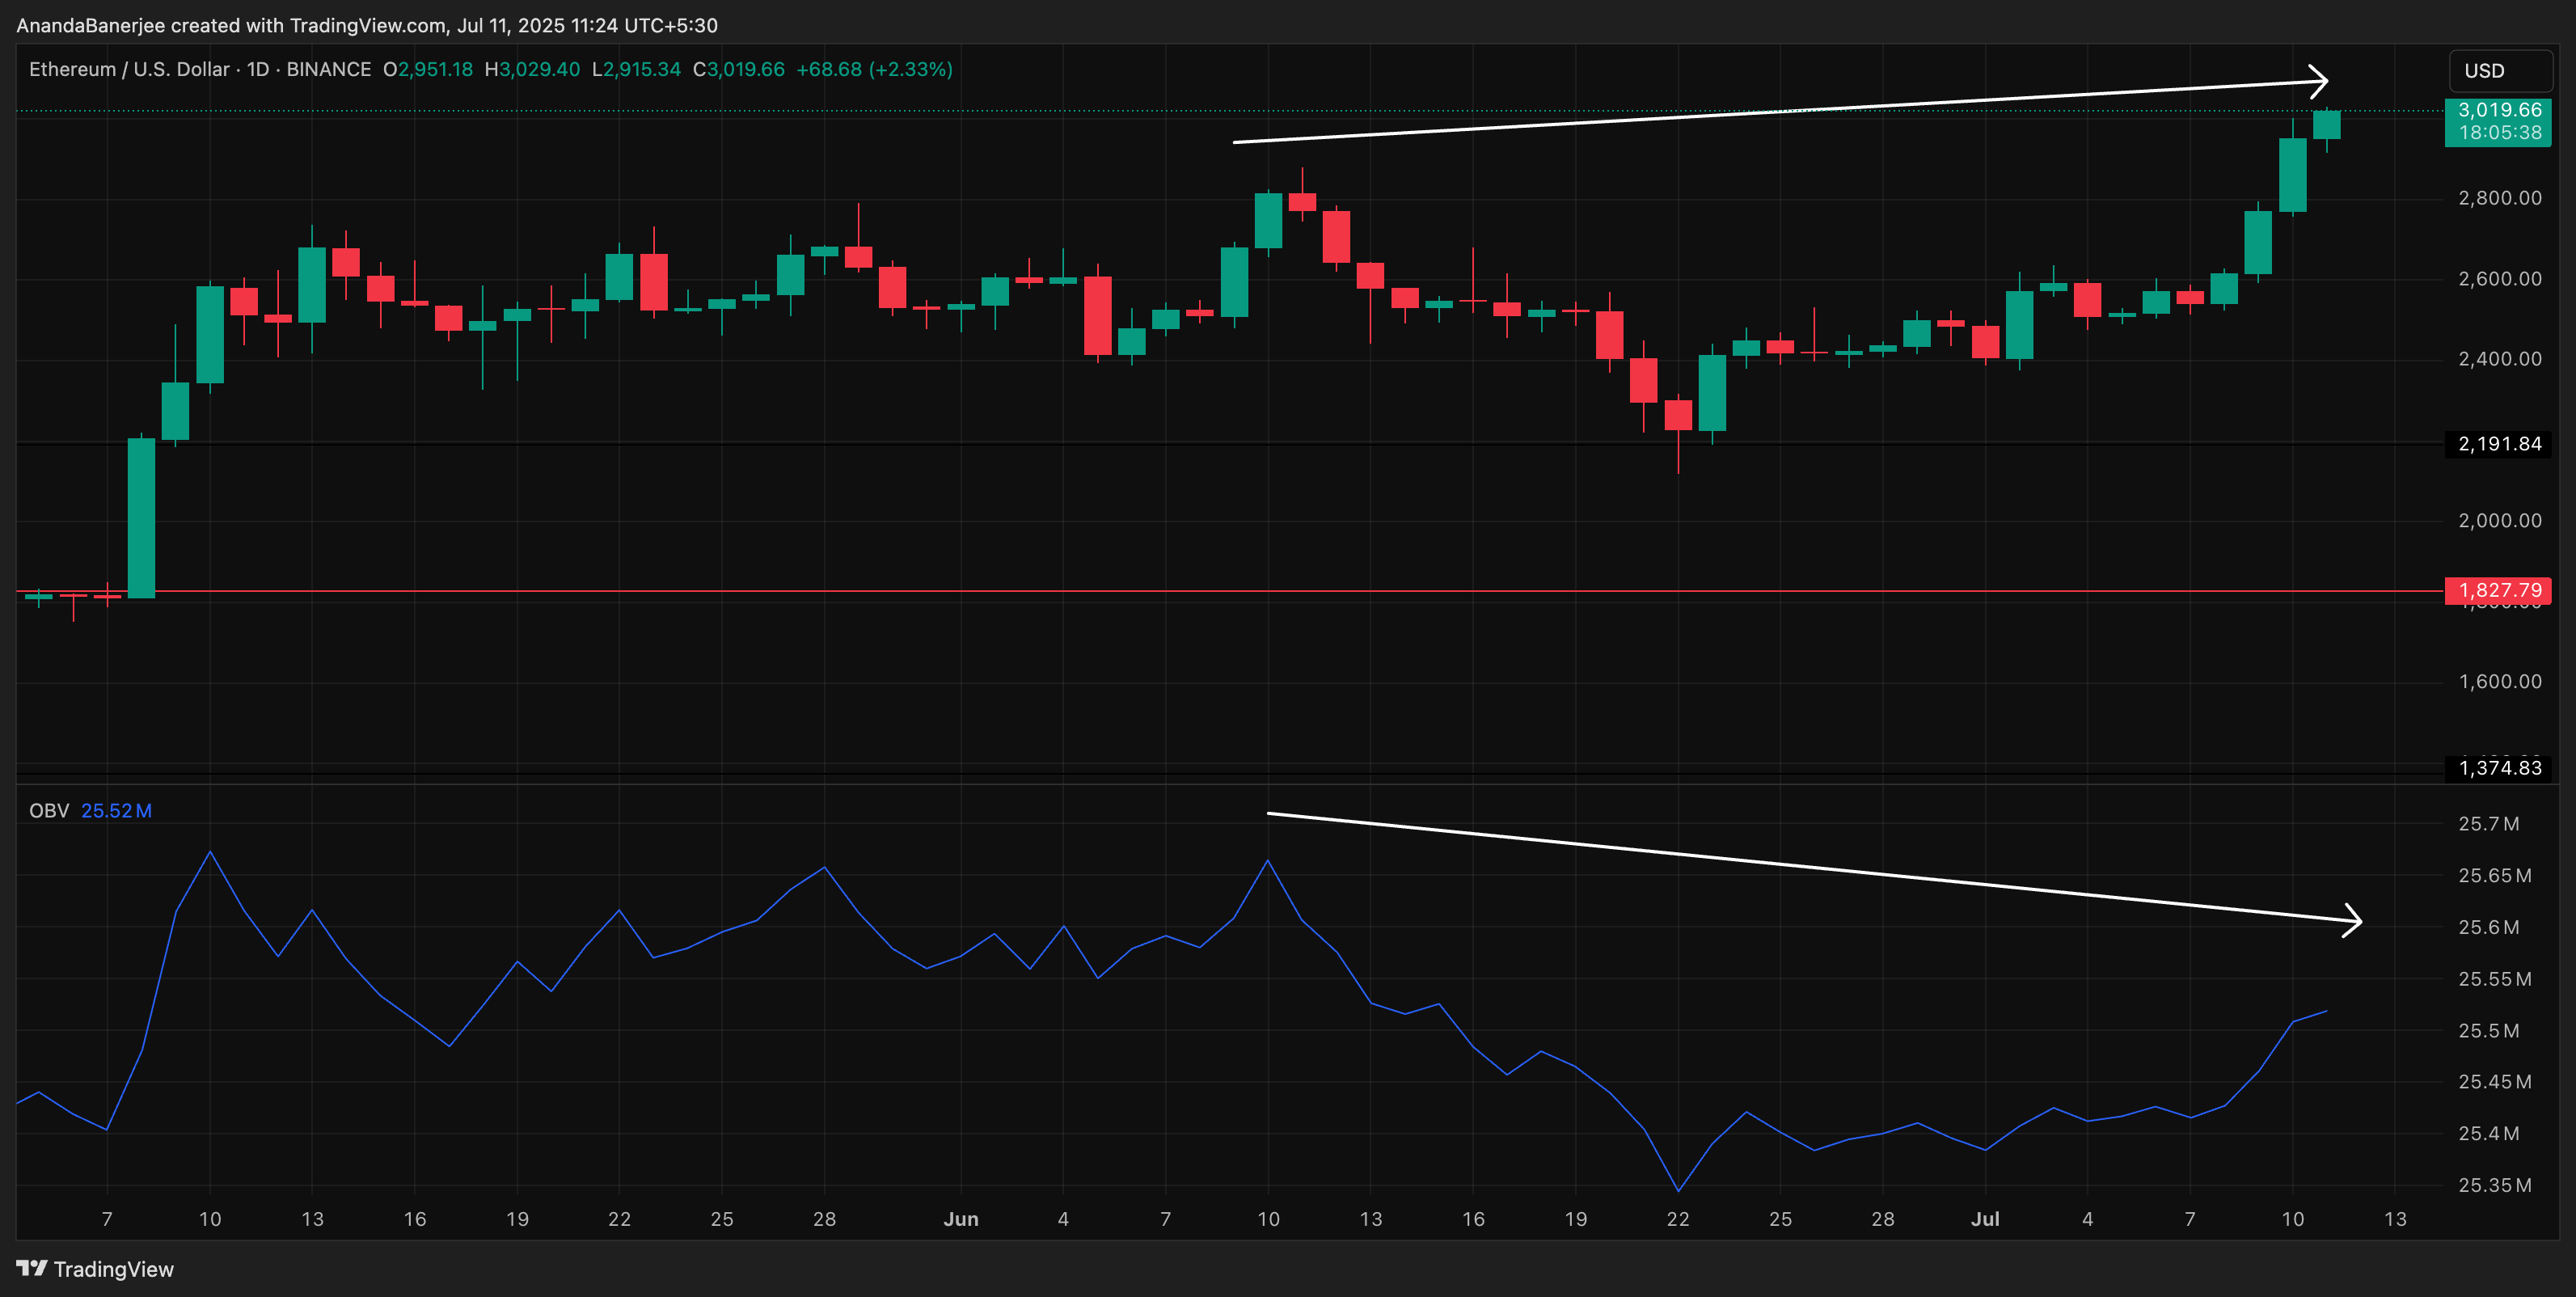
However, one key metric is flashing a warning. Despite ETH’s price pushing higher, the On-Balance Volume (OBV) has failed to break past its previous high from the last peak at $2,890. This divergence indicates that volume isn’t fully supporting the rally; a classic sign of momentum stalling.
OBV tracks the cumulative net volume. If price rises while OBV falls, it often signals weakening demand or fewer new buyers entering the market.
A breakdown below $2,693 would confirm the divergence’s weight at the 0.382 Fib level. This level would become the technical invalidation point and could push ETH prices towards $2,475 or lower.
The post Ethereum Crossed $3,000 as Retail Demand Spikes; Will Momentum Hold? appeared first on BeInCrypto.