Neither bulls nor bears are dominating at the beginning of the weekend.
Top coins by Coinstats
ETH/USD
The price of Ethereum (ETH) has declined by 0.44% since yesterday.
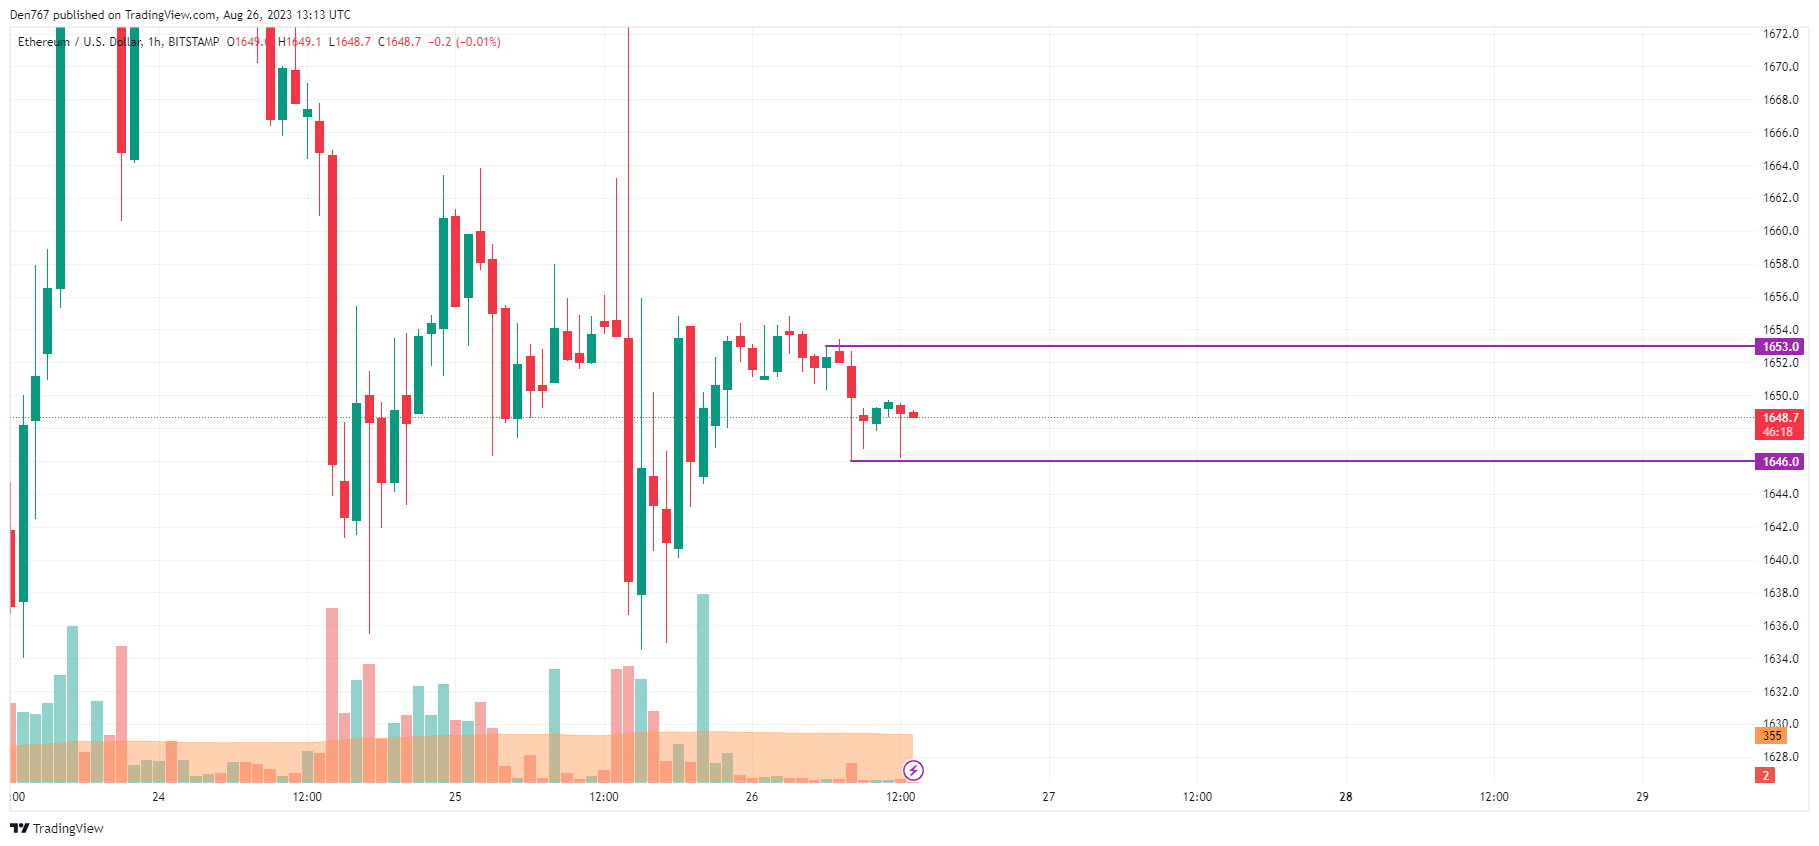
Image by TradingView
On the hourly chart, the rate of Ethereum (ETH) is looking bearish as the price is on the way to test the local support at $1,646. If the situation does not change, the breakout may lead to a drop to the $1,640 mark tomorrow.
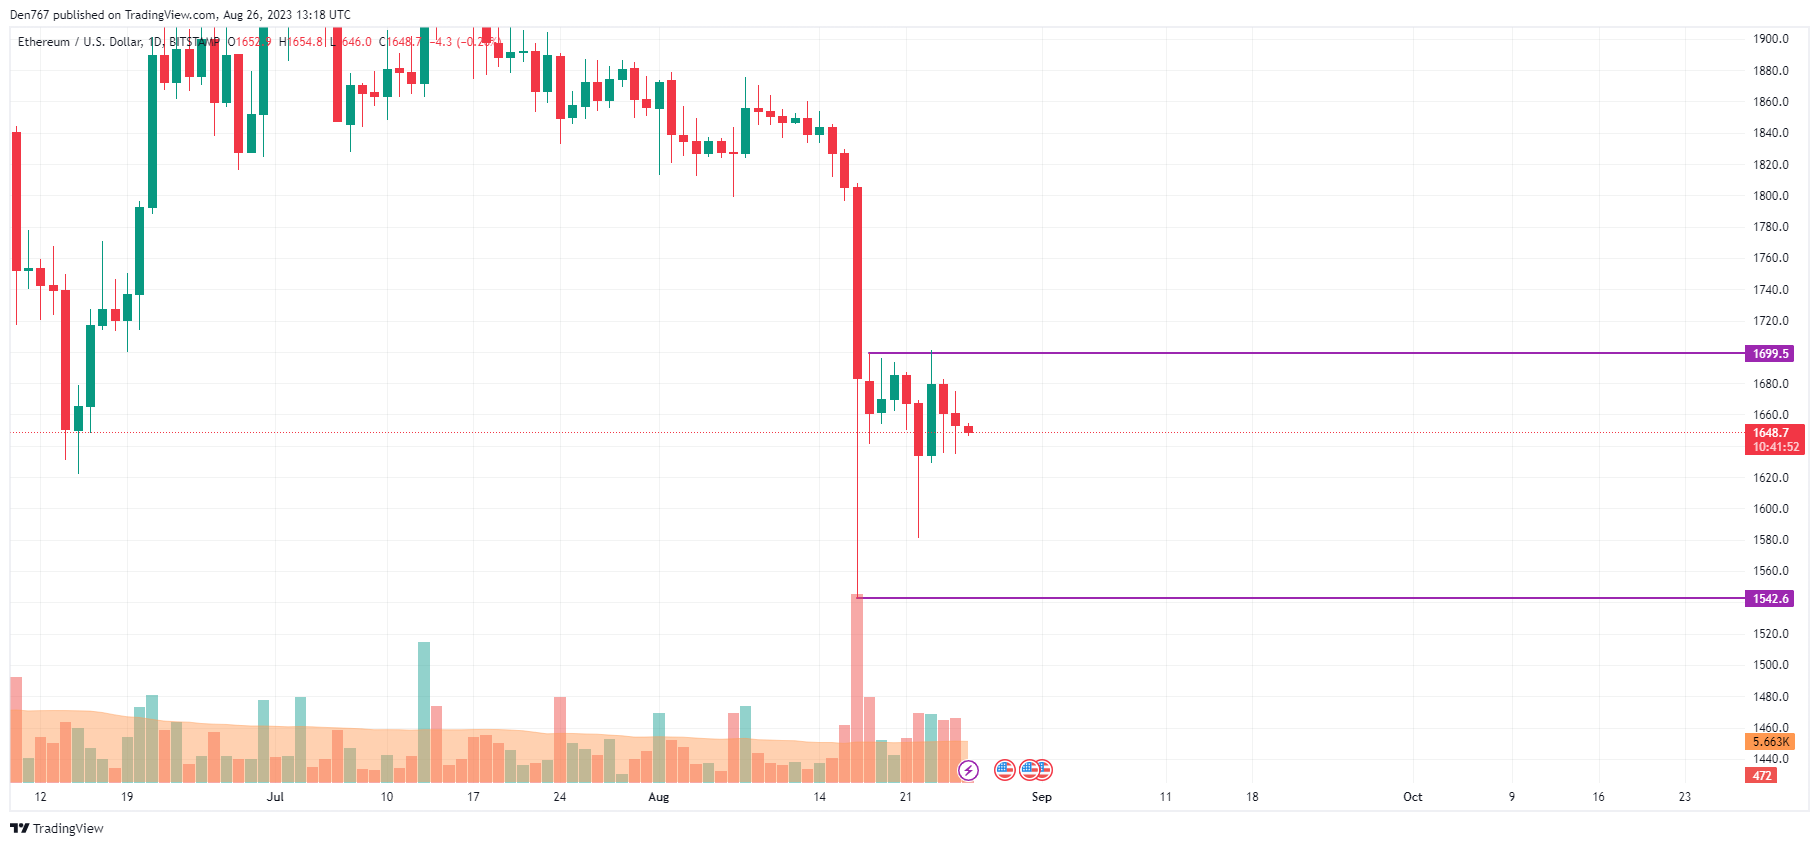
Image by TradingView
On the bigger time frame, the price of ETH is trading sideways as the rate is far from the support and resistance. However, if bulls lose the vital zone of $1,600, there is a high possibility of a test of the $1,542 mark soon.
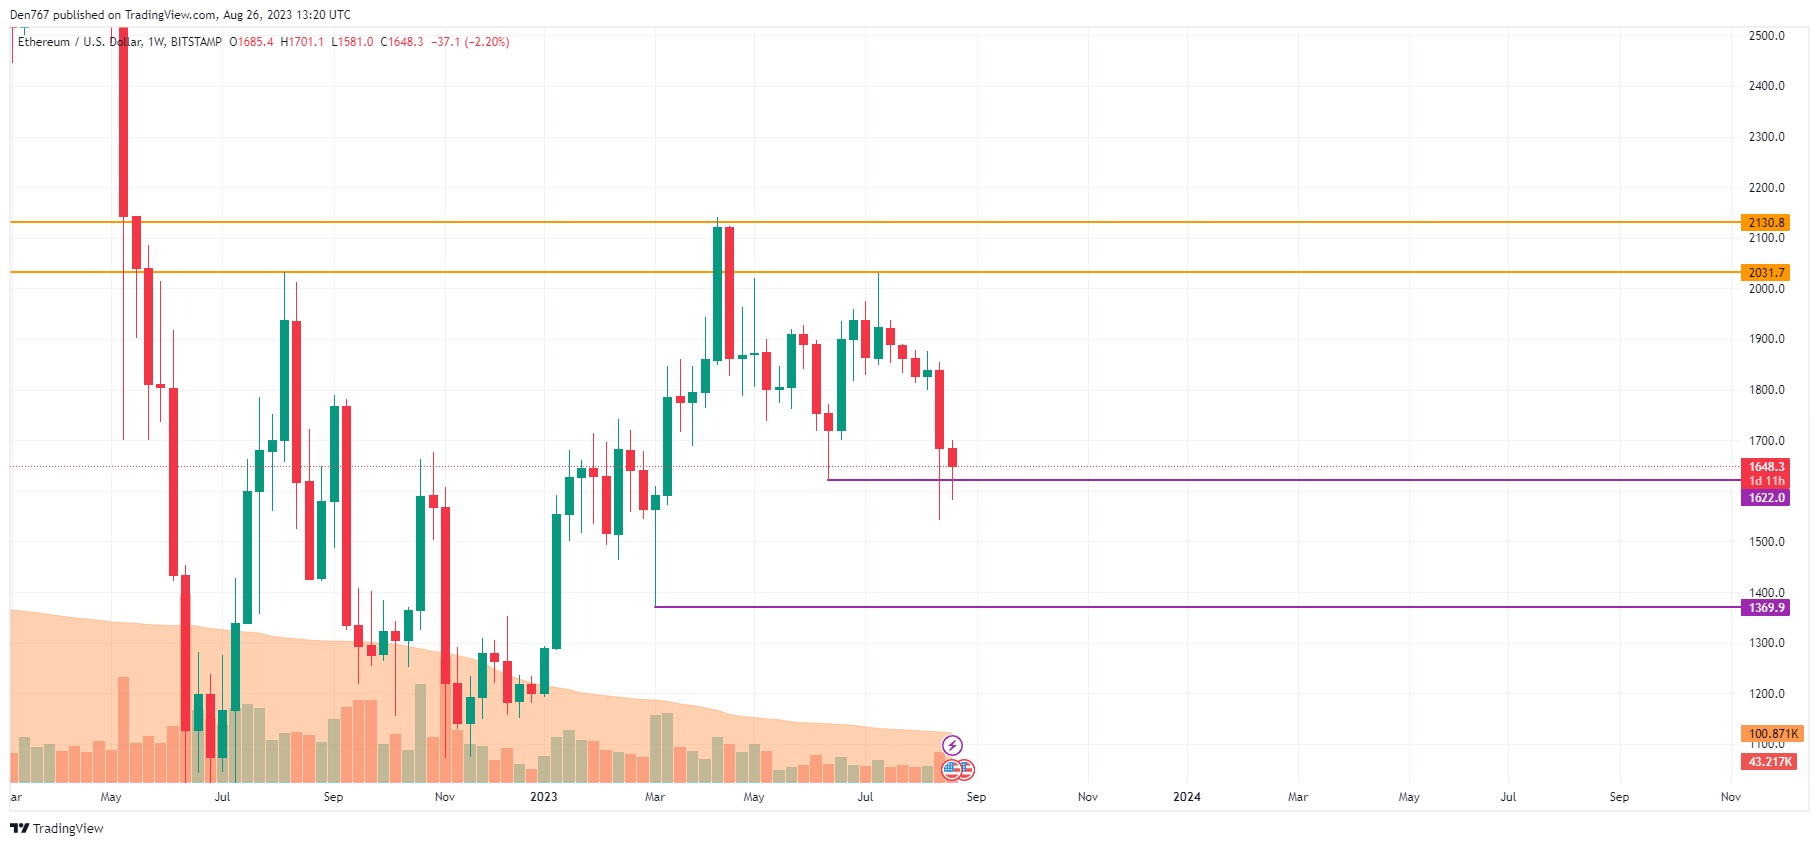
Image by TradingView
From the midterm point of view, one should pay attention to the bar closure. If it happens near the closest level of $1,622 or below, the correction is likely to continue to the $1,400 area. Such a scenario is relevant until mid-September.
Ethereum is trading at $1,648 at press time.