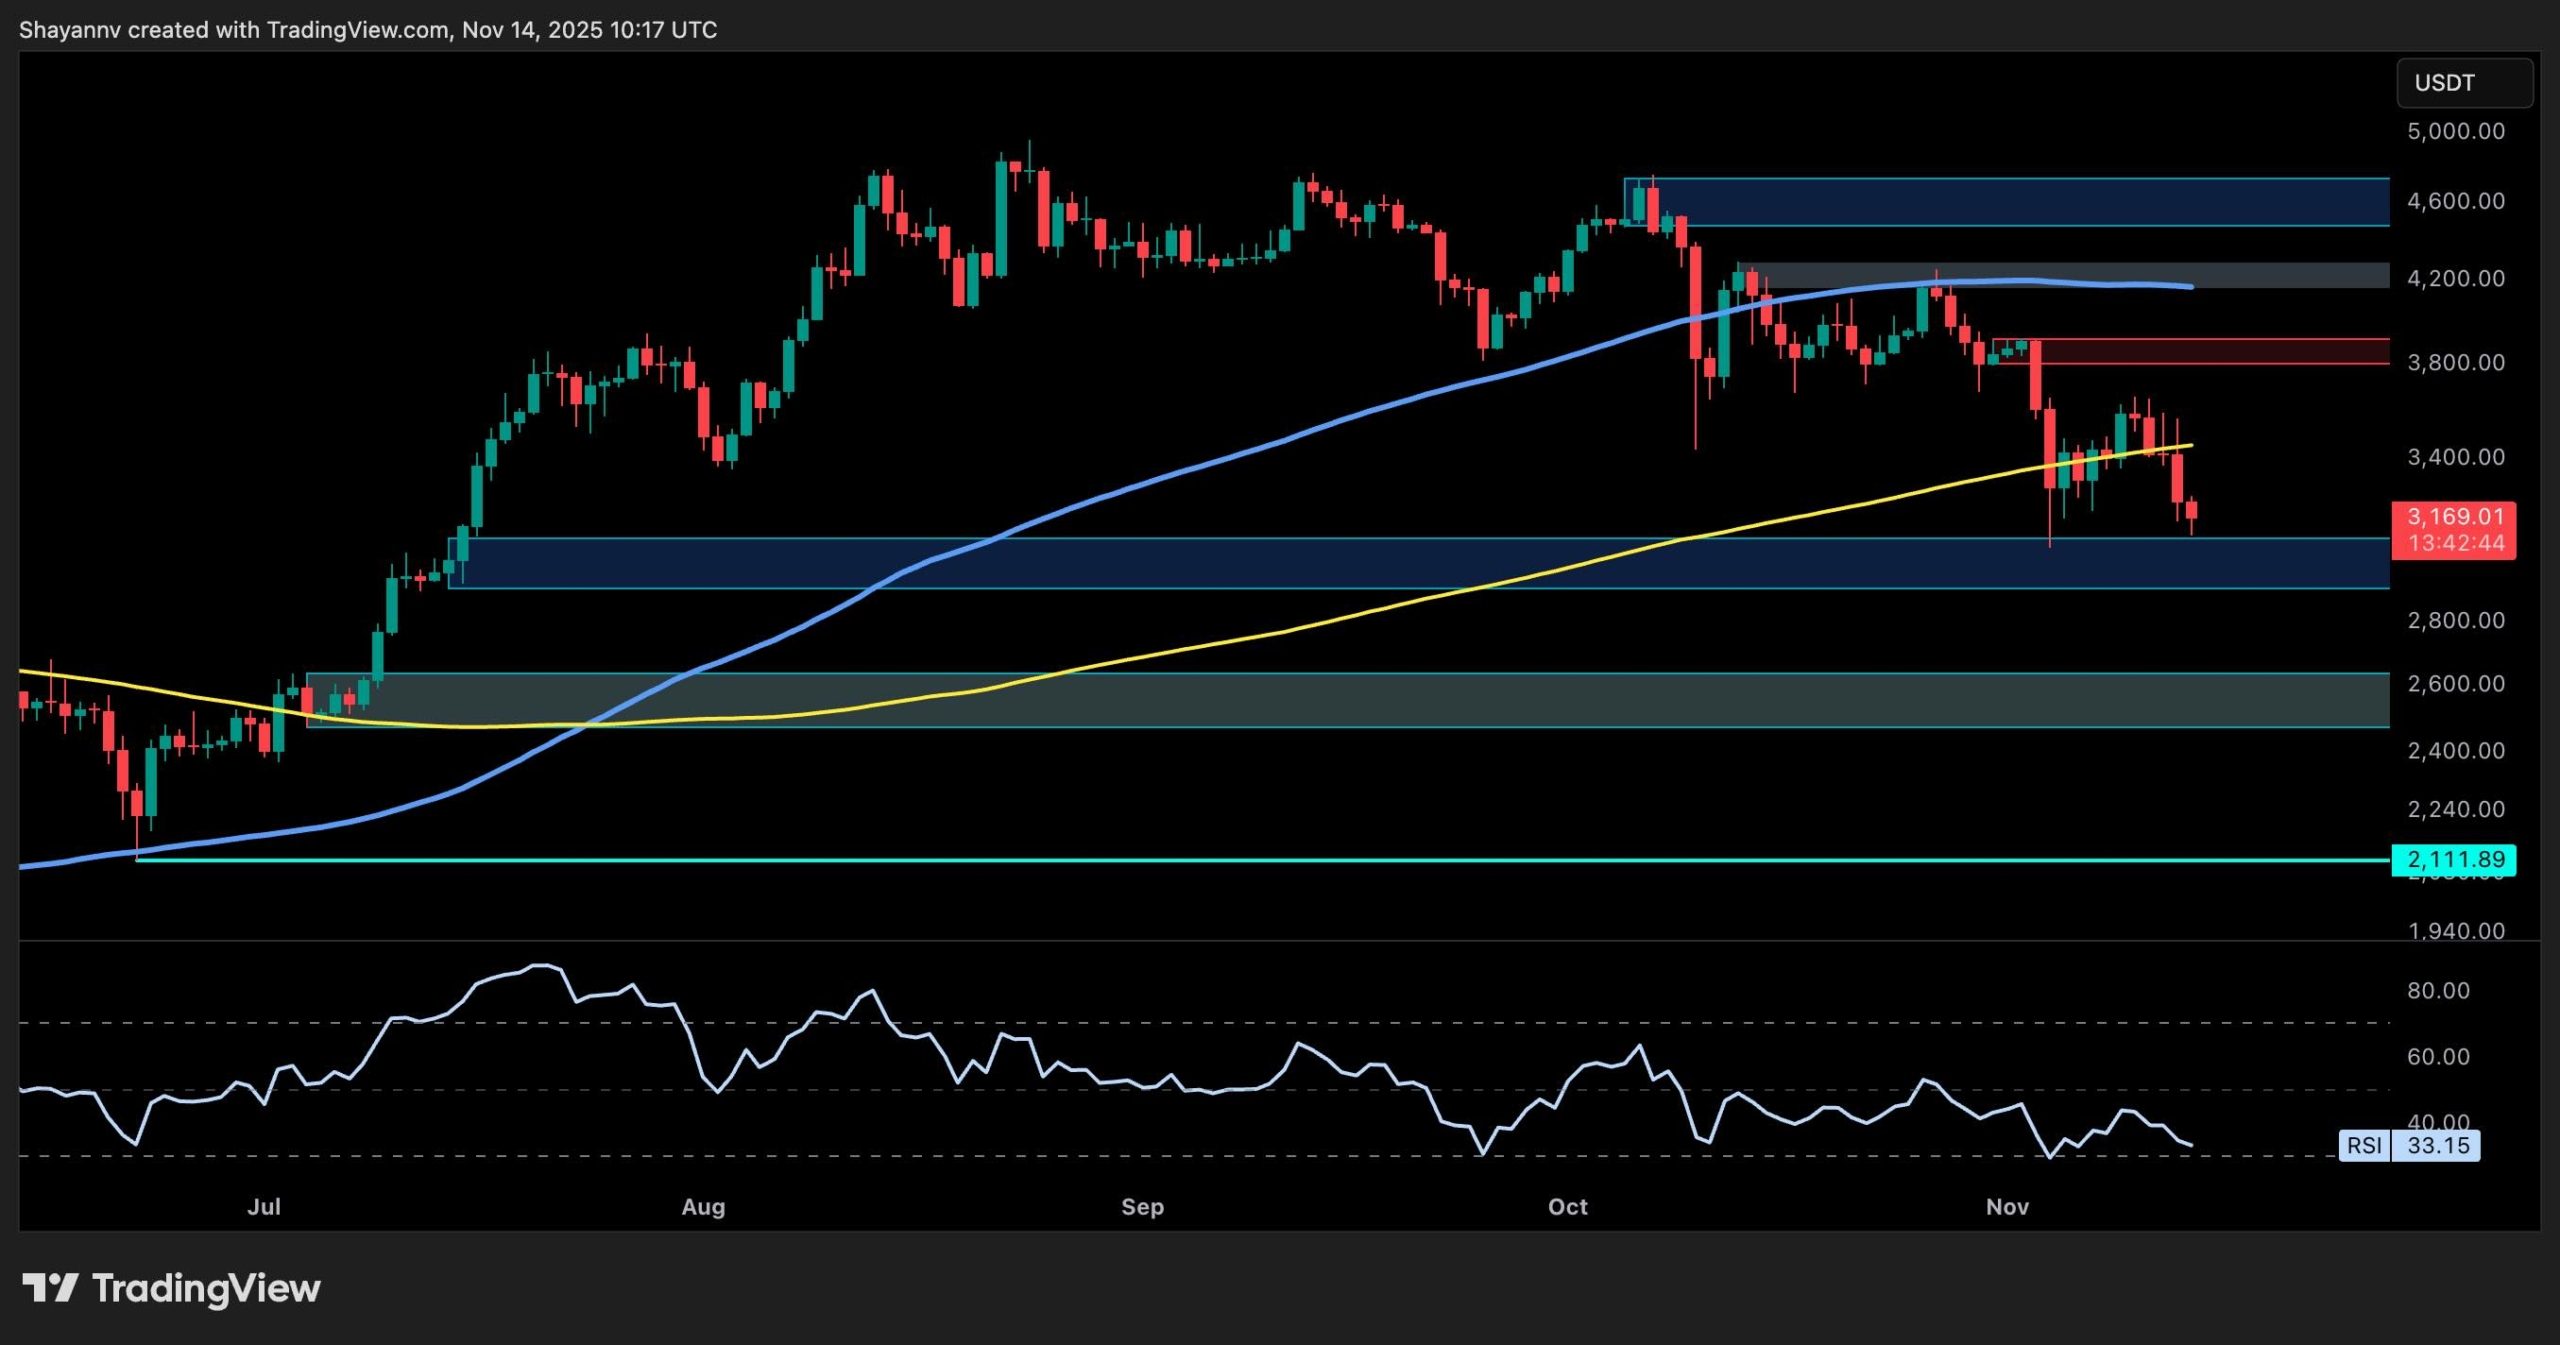
Ethereum has now broken back below the $3,200 mark after failing to hold the 100-day moving average. Despite the broader downtrend playing out over the past few weeks, the on-chain supply dynamic remains interesting. But technically, the buyers are losing ground fast as momentum shifts further in favor of the sellers.
Technical Analysis
By Shayan
The Daily Chart
On the daily timeframe, ETH is holding just above a key support zone around $3,000. The price has dropped below the $3,800 level and the 100-day moving average, located around the $3,400 mark, flipping both levels into resistance. The 200-day MA is also gradually sloping down now, reflecting weakening medium-term trend strength.
The RSI has also dropped to around 33, which shows bearish momentum but also brings ETH closer to oversold territory. If the asset fails to hold above $3,000, the next major support sits around the $2,500 zone, which also aligns with a previous demand area from early Q3. If buyers want to regain control, they need to reclaim $3,800 with strong volume and flip the 100-day and 200-day moving averages again.
The 4-Hour Chart
On the 4-hour chart, ETH broke the bearish flag to the downside and confirmed a continuation lower. After failing to reclaim the $3,600 resistance area, the price sold off hard and is now testing the demand zone at $3,000. The structure remains bearish with clear lower highs and lower lows forming since early October.
Momentum also remains weak. The RSI is hovering around 33 on this timeframe too, showing potential for further downside. If the $3,000 support zone breaks, the $2,600 area becomes the next key level to watch. Short-term bounces toward $3,300 or even $3,400 may simply offer sell opportunities unless accompanied by a volume spike and a clean breakout above the $3,800 resistance zone.
On-Chain Analysis
Exchange Reserve
Exchange reserves for Ethereum continue to drop and are now at multi-year lows. With just over 15 million ETH sitting on centralized exchanges, this is a structurally bullish sign over the long run, which indicates a continued trend of accumulation and self-custody.
However, despite this bullish supply trend, the recent price action shows that demand isn’t strong enough to absorb current spot selling. In other words, the supply is low, but buyers aren’t stepping in aggressively enough, which allows corrections like the one being witnessed now. Until demand picks up meaningfully, the price may stay under pressure even with positive on-chain flows.
SECRET PARTNERSHIP BONUS for CryptoPotato readers: Use this link to register and unlock $1,500 in exclusive BingX Exchange rewards (limited time offer).
Disclaimer: Information found on CryptoPotato is those of writers quoted. It does not represent the opinions of CryptoPotato on whether to buy, sell, or hold any investments. You are advised to conduct your own research before making any investment decisions. Use provided information at your own risk. See Disclaimer for more information.
Cryptocurrency charts by TradingView.
