
Dogecoin price trades near $0.231 after rising over 6% in the past 24 hours. Yet, on the month-on-month timeframe, DOGE is still down about 1.4%, but the broader three-month trend shows a 21.2% gain.
Now, on-chain metrics and chart signals suggest this 24-hour bounce could extend further. There are four key signs in play that hint at a path to $0.248, beyond which the DOGE price structure may become significantly more bullish.
Dip Buying Trend Strengthens
One of the strongest signs comes from HODL waves, which track how long coins are held before moving again. Over the past month, the 1–2 year cohort increased its share from 21.65% to 23.24%. This group adding to its stash is often seen as the most bullish sign, since they usually buy with conviction.
Want more token insights like this? Sign up for Editor Harsh Notariya’s Daily Crypto Newsletter here.
At the same time, 1–3 month holders raised their share from 5.43% to 6.58%. This shows that both patient long-term investors and active short-term traders are building positions.
This steady buying trend aligns with what we see on the 4-hour chart. The Money Flow Index (MFI), which measures the direction of money flow, has been trending upward since early September. On the daily chart, we see long candles that hide small dips. However, the 4-hour chart provides a clearer view of those dips, and the MFI there indicates that each one has been bought quickly.
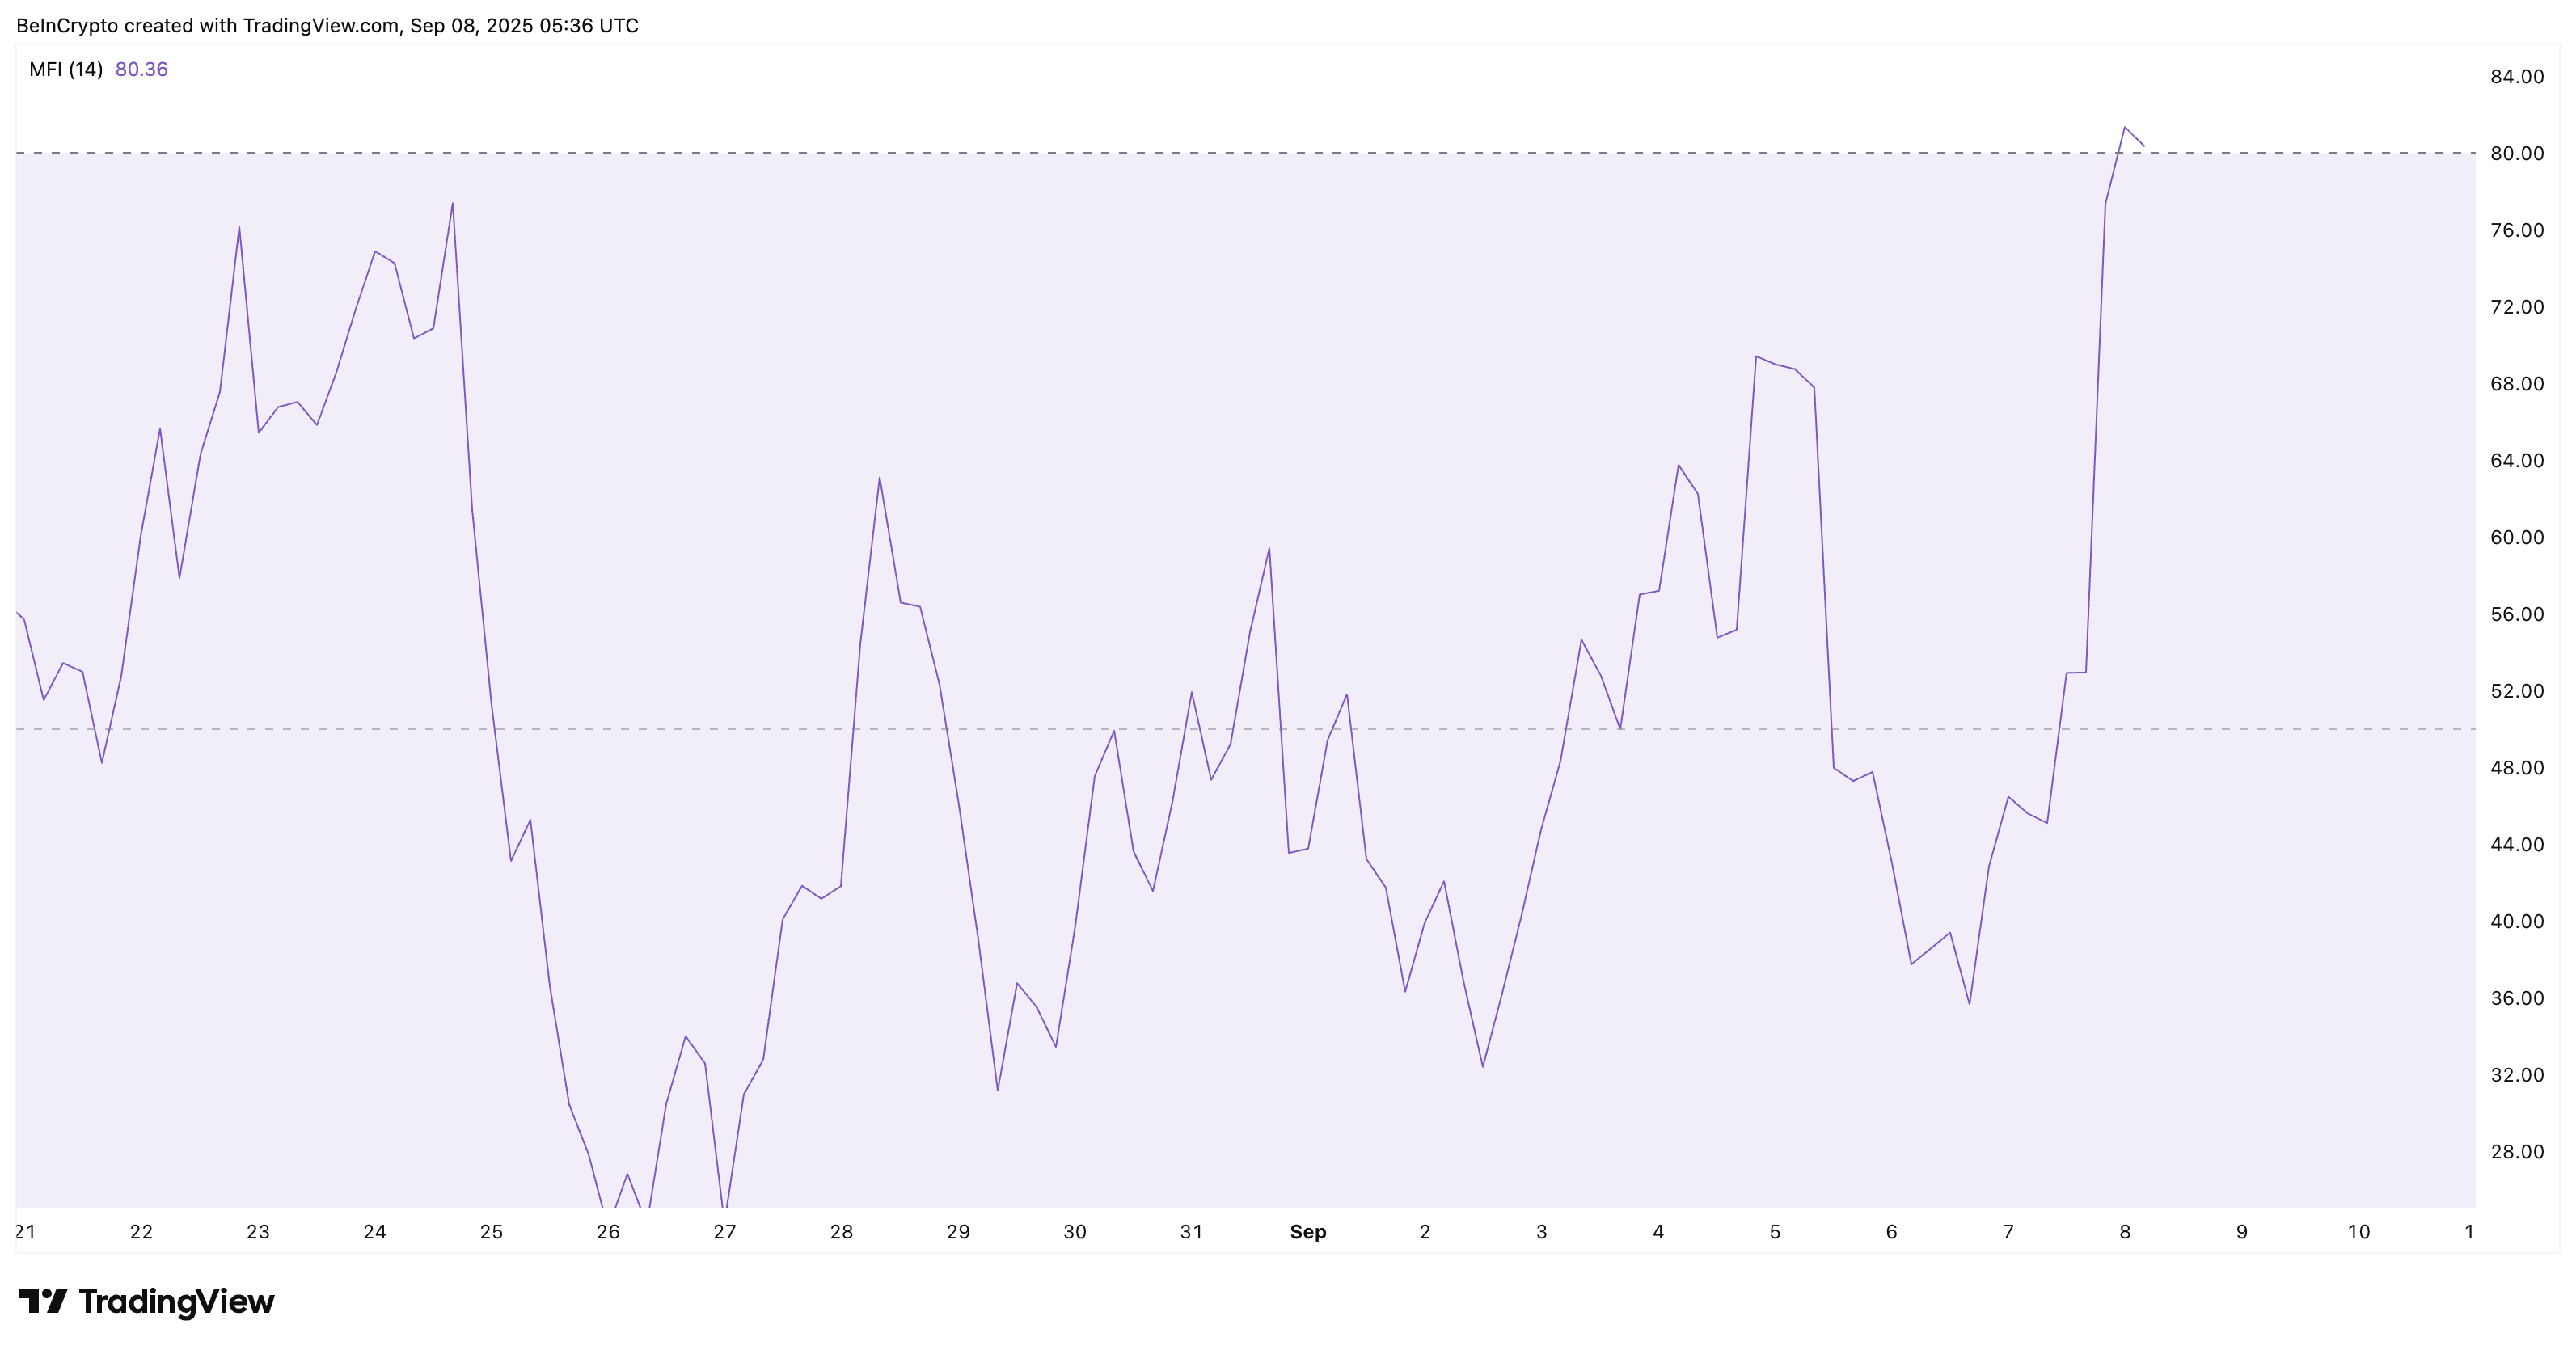
Together, HODL waves and MFI confirm that dip buying is happening in real time, giving Dogecoin price a strong base for further gains.
Breakout Pattern Points To A Higher Dogecoin Price Target
HODL waves and the Money Flow Index already showed that dip buying is active. The technical charts add two more reasons why the Dogecoin price bounce could extend further.
The first is the breakout of an inverse head-and-shoulders pattern on the 4-hour chart.
This setup often signals the end of a bearish phase. On the daily chart, it can indicate a complete trend reversal with significantly higher targets; however, the 4-hour version provides us with short-term targets. For now, the target is near $0.248, approximately 7.4% higher than the current level of $0.231.
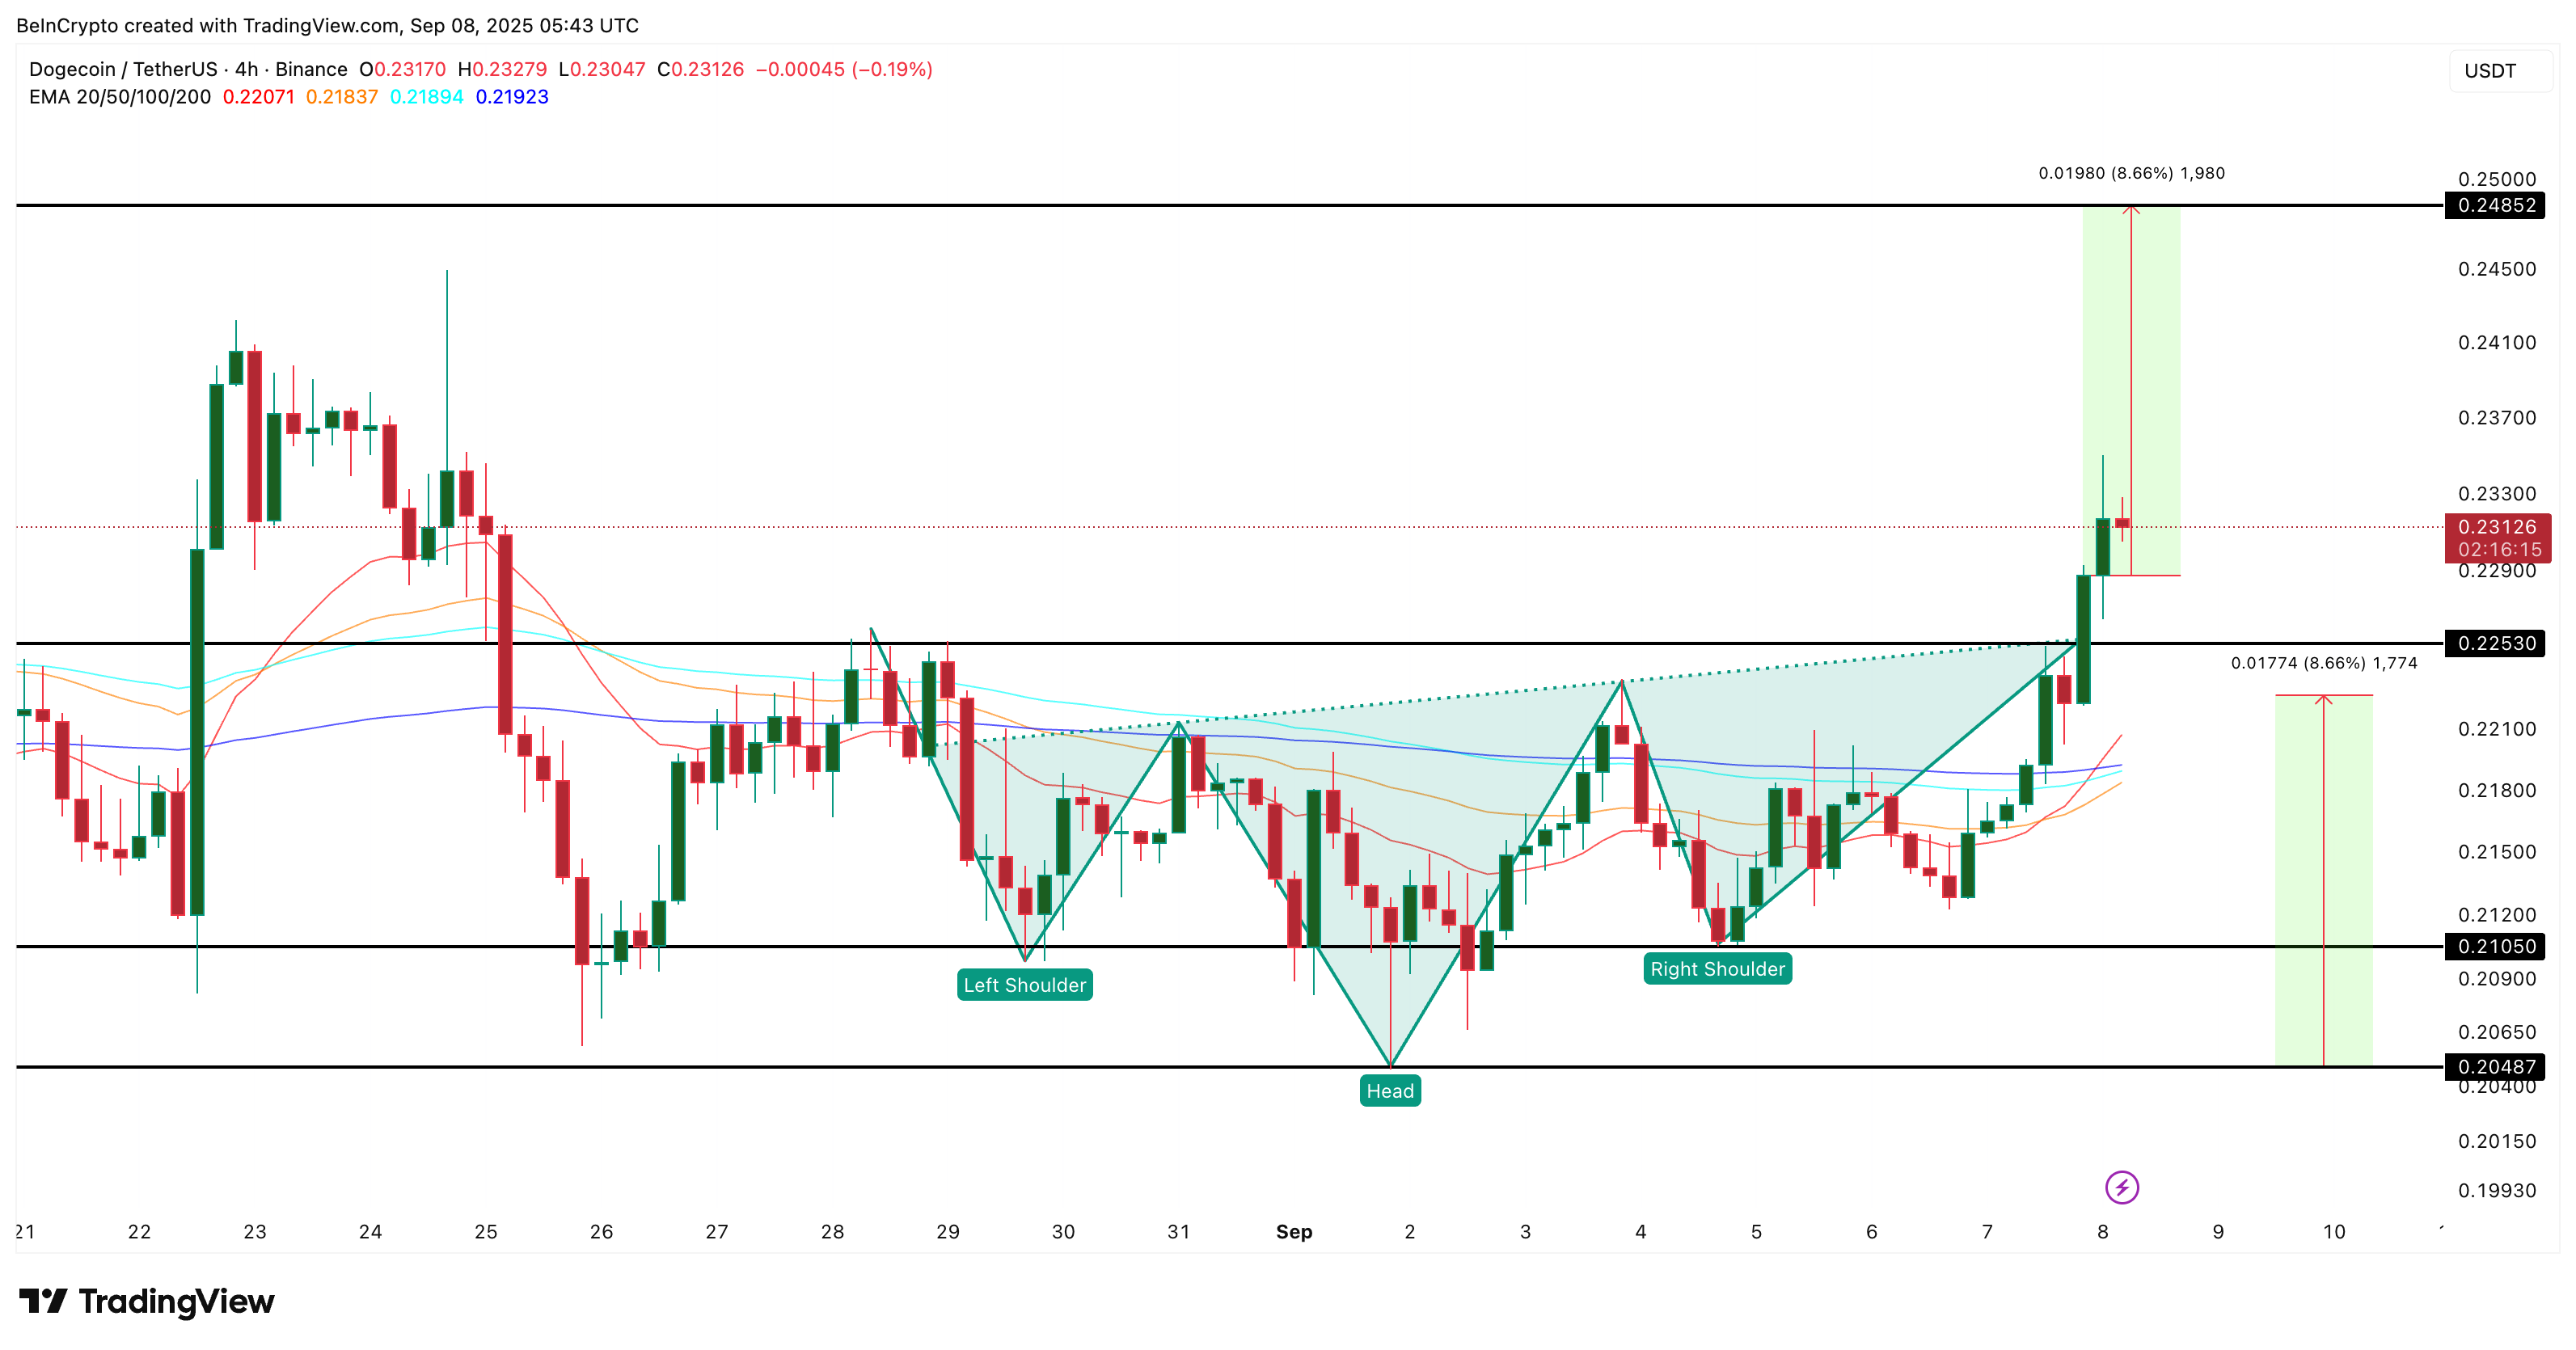
If DOGE clears this, it would undo its recent month-on-month losses and align again with the broader three-month uptrend, which is already up more than 20%.
Adding to the case are the exponential moving averages (EMAs), which smooth out price data by giving more weight to recent candles. The 20-period EMA, shown as a red line, crossed above the 200-period EMA, shown as a deep blue line, as the breakout surfaced.
Traders refer to this as a “golden crossover,” a bullish indicator that momentum is shifting. Two more crossovers are lining up: the orange 50 EMA is nearing the sky-blue 100 EMA, and the 100 EMA itself is closing in on the 200 EMA. If these crossovers confirm, they could act as fuel to push Dogecoin toward $0.248 and even higher.
Still, traders must keep invalidation levels in mind. A slip under $0.210 would weaken the pattern, while a break below $0.204 — the head of the setup — would fully cancel the bullish view.
For now, though, with dip buyers active and other bullish signals stacked together, the path of least resistance for Dogecoin price looks upward.
The post Fantastic Four Reasons Why Dogecoin’s 6% Bounce Could Extend Further appeared first on BeInCrypto.