
Bitcoin has surged past the $117,000 level following the Federal Reserve’s decision to cut interest rates by 25 basis points. The move was widely anticipated, but it has now set the stage for what many analysts describe as a new phase for the crypto market. With lower borrowing costs and improved liquidity conditions, investors are increasingly optimistic that Bitcoin could soon challenge its all-time high near $124,000.
This bullish momentum reflects broader market sentiment, where traders expect further upside as macroeconomic conditions align in favor of risk assets. Yet, not all signals are pointing upward. Despite the renewed optimism, certain analysts are warning that institutional selling may weigh on price action in the coming weeks. According to data shared by top analyst Darkfost, Galaxy Digital has been steadily offloading its Bitcoin holdings, transferring coins to private addresses and exchanges.
Such movements raise questions about potential selling pressure, even as demand from other segments of the market builds. While retail and institutional inflows support a bullish case, profit-taking from large holders could inject volatility. The coming weeks will test whether bullish momentum can overpower these headwinds and push Bitcoin into uncharted territory.
Galaxy Digital’s Bitcoin Moves Spark Market Top Speculation
According to data shared by Darkfost, Galaxy Digital has continued its selling activity, moving more than 800 BTC in a single day through private wallets and major exchanges. Transfers included deposits to OKX, Bitstamp, and Binance, with one particularly notable transaction sending 131 BTC directly to Fidelity. Such targeted moves have sparked significant discussion among traders and analysts, as they may signal a shift in institutional positioning.
For many investors, this pattern of distribution is a red flag. Galaxy Digital’s steady offloading contrasts sharply with the bullish narrative that has dominated the market since Bitcoin’s breakout above $117,000. While the Fed’s 25bps rate cut has created a favorable macro backdrop, large-scale selling from institutional players suggests that some big holders may be preparing for a potential correction. Analysts warning of a market top point to these moves as evidence that whales are using the rally to secure profits.
At the same time, others argue that selling from a single player—even one as influential as Galaxy Digital—does not necessarily negate the broader uptrend. Inflows from retail and other institutions remain strong, with Bitcoin’s technical structure still pointing toward bullish continuation if momentum holds.
Ultimately, the divergence between institutional profit-taking and retail/institutional inflows highlights the tension in the market. If selling accelerates, short-term volatility could test Bitcoin’s resilience. But if demand absorbs these moves, Bitcoin may still be on track to push toward new all-time highs in the weeks ahead.
Testing Key Resistance Level
Bitcoin is trading at $117,286, showing resilience as it consolidates near critical resistance levels. The chart highlights the importance of the $123,217 zone, which has acted as a ceiling in recent months. A breakout above this level would likely open the door for Bitcoin to retest all-time highs and potentially establish new ones.
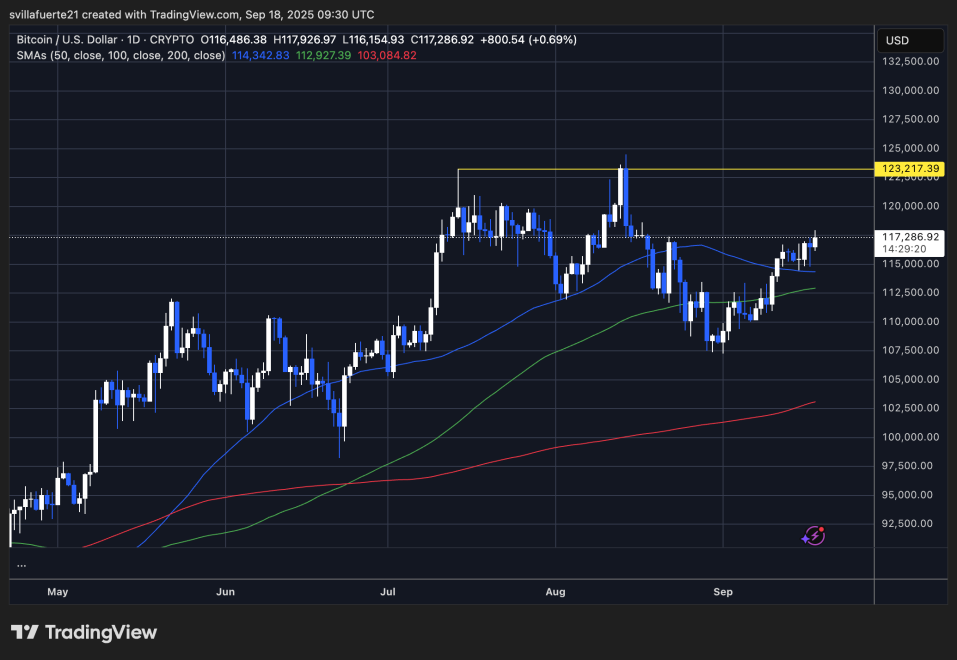
The moving averages provide additional confirmation of bullish momentum. The 50-day SMA is trending upward, currently supporting price action near $114,342, while the 100-day SMA around $112,927 adds another layer of reinforcement below. These levels are crucial, as they now act as dynamic support, suggesting that dips are being bought aggressively. Meanwhile, the 200-day SMA sits much lower at $103,084, reflecting the broader long-term bullish trend.
For now, Bitcoin is positioned in the upper third of its range, but it lacks a decisive impulse. Bulls must push above $118,000–$120,000 convincingly to build momentum toward a breakout at $123K. On the downside, a failure to hold above $115K could invite short-term selling pressure.
Featured image from Dall-E, chart from TradingView