Reason to trust
Strict editorial policy that focuses on accuracy, relevance, and impartiality
Created by industry experts and meticulously reviewed
The highest standards in reporting and publishing
Strict editorial policy that focuses on accuracy, relevance, and impartiality
Morbi pretium leo et nisl aliquam mollis. Quisque arcu lorem, ultricies quis pellentesque nec, ullamcorper eu odio.
Este artículo también está disponible en español.
Hedera Hashgraph (HBAR) is showing strong signs of recovery, surging over 20% in the past week as bullish momentum sweeps across the broader crypto market. Despite continued macroeconomic uncertainty and global financial instability, Bitcoin’s recent price jumps have reignited optimism, lifting the entire market with it. HBAR is now trading near a critical resistance level, and traders are watching closely for confirmation of a sustained uptrend.
Related Reading
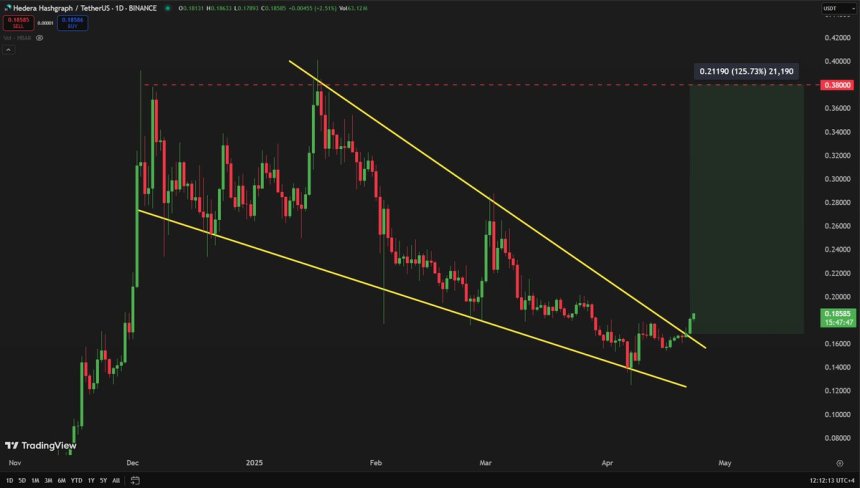
Top analyst Carl Runefelt shared insights on X, noting that HBAR has officially broken out of a massive falling wedge pattern—an important bullish technical signal. Falling wedge breakouts often precede sharp upside moves, especially when backed by strong volume and broader market support. As HBAR rides this momentum wave, investors are eyeing higher targets if key resistance levels are flipped into support.
With renewed risk appetite across crypto and leading assets like Bitcoin paving the way, HBAR could be positioning itself for a significant continuation rally. However, market conditions remain volatile, and any pullback from broader sentiment shifts could test HBAR’s strength. For now, bulls appear to be in control—and if the breakout holds, HBAR may soon target fresh local highs.
HBAR Eyes Continuation Amid Renewed Crypto Momentum
Hedera Hashgraph (HBAR) is trading at a crucial turning point as bulls continue to apply pressure following a sharp breakout from a long-standing downtrend. The asset remains over 50% down from its local highs earlier this year, but recent developments suggest that HBAR could be gearing up for a strong reversal, especially as broader market sentiment begins to improve.
Global tensions and ongoing trade war fears between the US and China continue to rattle equities and traditional markets. However, crypto assets are beginning to diverge from this trend, with Bitcoin leading a notable move higher that has started to lift altcoins like HBAR. This decoupling could mark the beginning of a fresh rotation into digital assets as investors seek growth outside of conventional markets.
Runefelt insights highlight that HBAR has broken out of a massive falling wedge pattern, typically a bullish reversal signal. This breakout confirms the potential for upward momentum, especially if HBAR can continue to push through current supply zones. The next key target sits around the $0.38 level, but for that to materialize, bulls must maintain pressure and sustain higher lows in the coming sessions.

If momentum holds and macro fears ease even slightly, HBAR could be poised to surprise the market with a sharp rally.
Related Reading
Price Tests Key Resistance Amid Bullish Momentum
HBAR is currently trading at $0.185 as it tests a critical resistance zone around the 200-day Exponential Moving Average (EMA). Bulls are now aiming to reclaim the $0.20 level, which also aligns closely with the 200-day Simple Moving Average (SMA). A clean breakout above this range would confirm the bullish momentum and potentially open the door for a rally toward higher levels, including the $0.25 mark.

After surging more than 20% in the past week, HBAR’s price action is showing early signs of strength, but confirmation is needed. Holding above $0.185 and pushing through the $0.20 barrier would validate the recent breakout from a falling wedge pattern and suggest that bulls are in control.
However, the rally remains fragile. If HBAR fails to hold above the $0.175 level, it could face a deeper retracement and return to previous support zones near $0.15. That would invalidate the current breakout structure and increase bearish pressure.
Related Reading
Traders are now watching closely as HBAR battles with long-term moving averages—levels that often serve as a dividing line between bear and bull phases. The next few sessions will likely determine whether HBAR confirms its uptrend or returns to consolidation.
Featured image from Dall-E, chart from TradingView
